Download
1 / 34
340 likes | 489 Vues
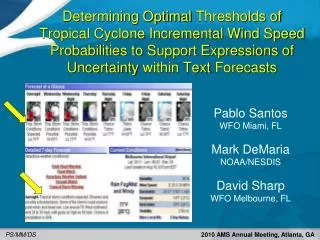
Determining Optimal Thresholds of Tropical Cyclone Incremental Wind Speed Probabilities to Support Expressions of Uncertainty within Text Forecasts. Pablo Santos WFO Miami, FL Mark DeMaria NOAA/NESDIS David Sharp WFO Melbourne, FL. PS/MM/DS. 2010 AMS Annual Meeting, Atlanta, GA .

E N D
Determining Optimal Thresholds of Tropical Cyclone Incremental Wind Speed Probabilities to Support Expressions of Uncertainty within Text Forecasts Pablo Santos WFO Miami, FL Mark DeMaria NOAA/NESDIS David Sharp WFO Melbourne, FL PS/MM/DS 2010 AMS Annual Meeting, Atlanta, GA
Probability Definitions (A Quick Review) • Cumulative – The probability of sustained winds reaching or exceeding the specified wind speed threshold between the 00 hour forecast and a specified forecast hour. • Available in Grid (NDFD)/Graphic Forms as well as within PWSAT# product. • Individual (Interval) – The probability of sustained winds reaching or exceeding the specified wind speed threshold beginning during a specified forecast period ending at the specified forecast hour (e.g., period of onset). • Computed from Cumulative and explicitly available in PWSAT# text product. • Incremental –The probability of sustained winds reaching or exceeding the specified threshold during a specified forecast period ending at the specified forecast hour. • Available in Grid (NDFD) but not within the PWSAT#. • These are the probabilities referenced throughout this presentation.
Wind Impacts Are A Concern Well Outside Of The Error Cone Based on 1938 Long Island Express Hurricane - a large fast-moving storm Tropical Storm Force wind probabilities are almost certain in a large area from the Carolinas to New England well outside the cone! 3 Hypothetical Test Case
Proposed WFO Use(Item 42-05 from NOAA Hurricane Conference, 2005) • During potential high impact weather events such as tropical cyclones (TC), users not only demand a WFO’s ‘best forecast’, but also require a corresponding expression of uncertainty for decision-making purposes. • Therefore, a methodology was developed that uses TC Incremental Wind Speed Probabilities to elevate the utility of official text forecast products: • By including situational expressions of uncertainty within the Zone Forecast Product (ZFP) and the Coastal Waters Forecast (CWF) which responsibly ‘scopes’ NHC’s forecast (temporally and spatially) for use within local forecasts. • For WFOs, this effort crosses a major threshold for incorporating probabilistic data (other than PoP) within their text forecast products.
Baseline Phraseology (The Nine Expressions of Uncertainty) • The *phrases are equivalent to imminent or ongoing conditions as • reflected in the 00-12 hour period simultaneously by the hazard, wind, and • probability grids. • The word EXPECTED is used in situations mainly during the Warning period, but is • also selectively used in the Watch period (e.g., Day 1 & 2, or out to period 4). • The word POSSIBLE is used during the extended period (e.g., Day 3 - 5), but is also • used in specific situations within Watch/Warning period. • Also, certain situations require compound phrases (e.g., when there is a Tropical • Storm Warning with a Hurricane Watch).
Determining Optimal Probability Thresholds • NHC verification program evaluates gridded products. • In this case as it pertains to WFO Forecast applications. • Sample: • 19 storms 2004-2008 cases with U.S. hurricane warnings along East and Gulf of Mexico Coasts from Brownsville, TX to Portland, Maine. • All probability runs starting 3 days before 1stwarning. • 2008 MC model re-runs for 400 forecast cases. • Evaluated probabilities at 343 coastal “breakpoints” as well as 286 inland points (approx. 50 km inland). • Use Threat Score or ROC diagrams to select optimal probability thresholds. • Emphasis placed on 12 h incremental probabilities. • Results for 34 & 64 knot probabilities were based on • 6 hourly NHC best track wind radii interpolated every hour to produce the model verification grid (used to determine points with observed hurricane/tropical storm force winds).
2010 Wind Speed Probability Model • Track and Intensity error statistics updated with previous 5 year sample • 2005-2009 • Track error distributions stratified by Goerss Predicted Consensus Error (GPCE) • GPCE estimates track forecast uncertainty from model spread and other forecast parameters • GPCE version implemented at NHC in 2010 • Includes option to run without GPCE input • 2010 model (GPCE and non-GPCE versions) run for all 2004-2008 WFO test cases • Coastal and inland points
Storm Cases For 400 MC Model Runs • Coastal Points • Inland Points
Conversion of Probabilities into Yes-No Forecast • Pick probability threshold (Pt) • If P ≥ Pt, forecast YES • If P < Pt, forecast NO • Best choice of Pt depends on particular application • Use appropriate validation metric to select Pt objectively • Metrics determined from contingency table
Observed Yes No Yes Forecast No a b c d Contingency Table for Validation of Yes-No Forecasts Threat Score (TS) = a/(a + b + c) Hit Rate (HR) or Probability of Detection (POD) = a/(a + c) False Alarm Rate (FR) = b/(b + d)
Regional Stratification • Estimate optimal probabilities using Threat Score • ROC score probabilities too low • Region 1 • Brownsville, TX to Mobile, AL • Region 2 • Mobile, AL to GA/SC Border • Includes all Florida breakpoints • Region 3 • GA/SC Border to Eastport, ME
Optimal 34 knot Probability Thresholds(Coastal vs. Inland) Based on Threat Score…collectively, and by each region.
Optimal 64 knot Probability Thresholds(Coastal vs. Inland) Based on Threat Score…collectively, and by each region.
Optimal 34 & 64 knotProbability Thresholds(Combined) Based on Threat Score…by region, for all points.
Summary • Optimal Probability Threshold curves decrease almost exponentially with time (for both 34 & 64 knot). • Optimal thresholds are correspondingly larger for inland points, particularly in the shorter ranges (e.g., watch/warning periods). • Optimal thresholds are a function of geographical location: • More so for 34 knot probabilities, in the short range, and for coastal points. • Overall, probabilities are deemed to be “reliable” although: • They tend to under predict 64 knot or greater events particular for coastal points. For all points combined, this bias is smaller. • Results indicate that the empirically-derived thresholds (original; based on histograms) need an upward adjustment in the short range to better support operational use.
Summary So Given this and… • That there is inherent operational sensitivity regarding event-specific reliability and continuity (forecast-to-forecast, region-to-region, coastal-to-inland, etc.), • That the current ZFP/CWF text formatters will only support one set (each) of 34 and 64 knot thresholds, • And that newer Monte Carlo based results by region are still forthcoming which will also include more cases, • …the following (interim) values to the right are the ones currently in effect for operational use. Proposed Single Set Values
Future Work • Iteratively transition optimal thresholds to ZFP and CWF text formatters, as well as point-n-click web forecast code. • single set • multi-set • coastal vs. inland • by region • Complete verification using 2010 version of the Monte Carlo model by regions.
Discussion Items 10-49 to 10-51Official Implementation of EoU • Problems Encountered During 2010 Season: • ER problem with phrases dropping Wx in presence of EoU. Investigating. • Offices editing probability grids and questioning EoU with winds of 10 to 15 mph. Training Issue. • However, technical team suggests we can consider dropping the phrase if winds less than 15 kts and there is no warning. • Iteratively transition optimal thresholds to ZFP and CWF text formatters, as well as point-n-click web forecast code. • single set, multi-set, coastal vs. inland, by region
Discussion Items 10-49 to 10-51Official Implementation of EoU • Back Up sites will need training to be aware of this capability. Configuration wise it should not be a problem. • Public and Marine Directives will need to be updated to include set of rules that prompts EoU. • Work on instructions for field offices to enable Tropical SAF Formatter. MIA and MLB already have it. Baseline code is the same as the ZFP. It is a matter of configuration. • RECOMMENDATION: Official or Not? Reconvene Wind Team to oversee all issues above are taken care of whether it is by 2011 or 2012.
REFERENCES • DeMaria, M., J. A. Knaff, R. Knabb, C. Lauer, C. R. Sampson, and R. T. DeMaria, 2009: A new method for estimating tropical cyclone wind speed probabilities. Wea. Forecasting,24, 1573-1591. • Santos, P., D. Sharp, M. DeMaria, and S. Kiser, 2009: The Determination of Optimal Thresholds of Tropical Cyclone Incremental Wind Speed Probabilities to Support Expressions of Uncertainty in Text Forecasts. Preprints, Symposium on Urban High Impact Weather/89th AMS Annual Meeting, P1.5, Phoenix, AZ. [Available online http://ams.confex.com/ams/pdfpapers/147019.pdf] • Santos, P., D. W. Sharp, M. Volkmer, and G. Rader, 2008: Employing Hurricane Wind Probabilities to Convey Forecast Uncertainty and Potential Impact Through NWS Field Office Forecast Products. Preprints, Tropical Meteorology Special Symposium/19th Conf. on Prob. And Statistics, JP1.3, New Orleans, LA. [Available online http://ams.confex.com/ams/pdfpapers/131748.pdf] • Sharp, D. W., P. Santos, M. Volkmer, G. Rader, and M. Sardi, 2006: Employing Hurricane Wind Probabilities to Enhance Local Forecasts and Improve Guidance for Decision-Makers. Preprints, 27th Conf. on Hurricanes and Tropical Meteorology, 9A.3, Monterey, CA. [Available online http://ams.confex.com/ams/pdfpapers/108409.pdf]
Wind Impacts Are A Concern Well Outside Of The Error Cone Based on 1938 Long Island Express Hurricane - a large fast-moving storm Hurricane-force winds extended outside the cone over much of NJ, srn NY, LI, and CT 26 Hypothetical Test Case
Optimal 34 and 64 kt Probability Thresholds based on Threat Score and ROC Diagram for Coastal Points
Tropical Cyclone Wind Speed Probabilities Through NDFD • Note: • Go to weather.gov • Click on Graphical Forecasts • Scroll to the Bottom • Click on Tropical • Notice both Cumulative and Incremental Probabilities are available here • Notice the Resolution • What About Interval or Individual Probabilities? 29
How Can I get the grids from the NDFD • Download DeGrib (NDFD GRIB2 Decoder from): • http://www.weather.gov/mdl/NDFD_GRIB2Decoder/register.php • Then go to this site and read on how turn the NDFD gridded data into GIS Files (Creating GIS files from the downloaded NDFD grids): • http://www.weather.gov/ndfd/gis/ndfd_GIS_tutorial.html
Pt Optimization Procedures • Threat Score • Threat Score useful for low probability events since it does not include No-No cases • TS ranges from 0 to 1 (1 is best) • Pick Pt that maximizes TS • Hit Rate/False Alarm Rate • Plot HR vs. FR in 2-D plane for range of Pt • Relative Operating Characteristic (ROC) diagram • Pick Pt for point closest to upper left corner in ROC diagram • Upper left corner has Hit Rate=1, False Alarm Rate=0
A Second Algorithm Example Advisory Time: 20040813_1500 (0-12 Hours – First Period) CHARLEY (ZFP) * Punta Gorda Hurricane Charley (ZFP)