Forecasting Convective Mode and Severity
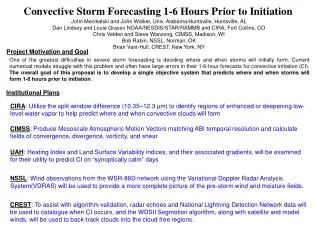
Forecasting Convective Mode and Severity. Mark F. Britt National Weather Service St. Louis, MO Mark.Britt@noaa.gov. Why Am I Here?. A Basic Review of Severe Thunderstorm Forecasting. Examine moisture return, instability, and shear calculations.


Forecasting Convective Mode and Severity
E N D
Presentation Transcript
Forecasting Convective Mode and Severity Mark F. BrittNational Weather ServiceSt. Louis, MO Mark.Britt@noaa.gov
Why Am I Here? A Basic Review of Severe Thunderstorm Forecasting. • Examine moisture return, instability, and shear calculations. • Examine how the amount and distribution of instability, vertical shear, and forcing interact to determine cell type, convective mode (linear or discrete), and coverage. • Determine what type(s) of severe weather to expect for a given environment.
Using Numbers • There are NO “magic” numbers or thresholds. They are merely guidelines. • Best to look where several key parameters overlap instead of depending on one index. • You should look at skew-Ts and hodographs (observed and forecast) to better understand what the numbers mean. • Increase your situation awareness by using near storm environment data, but do not use it solely to make warning decisions.
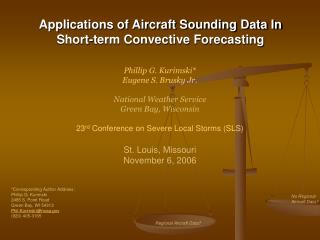
Objective Analysis • Available on AWIPS using MSAS, LAPS, or RUC40 analysis(Thompson et al. (2003)found RUC analysis is a reasonable proxy to observed soundings in supercell environments, except it can be too cool and dry at the lowest levels.) • Or, the SPC Mesoanalysis Page: http://www.spc.noaa.gov/exper/mesoanalysis/ • Displays a national and seven movable regions that is usually available by 20 minutes past each hour • Displays a robust set of hourly objective analysis datasets using the latest surface observations and upper air analysis from the RUC. Depicted contours highlight important “thresholds”.
Ingredients for Deep, Moist Convection • Moisture: (Gulf of Mexico, evapotranspiration) • Instability: (Steep lapse rates either from the Elevated Mixed Layer off the Rockies, or large scale “dry” ascent ahead of a trough.) • Forcing: (Surface frontal boundary, convective outflow, 900-800mb moisture convergence at nose of nocturnal low level jet, orographic lift over the eastern Ozarks)
Moisture Return Lanicci and Warner (1991) • Look for rapid moisture advection from the Gulf of Mexico in strong pressure gradients ahead of a strong storm system. • Ridging associated with surface highs in or near the Gulf can inhibit moisture return. • Be cognizant of how much dry air is over the Gulf (deep cold front penetrations of cold fronts, buoy data, and Blended Total Precipitable Water: http://amsu.cira.colostate.edu/GPSTPW/default.htm
Assessing Instability Which is best? • SBCAPE • MLCAPE • MUCAPE
Courtesy Peter Banacos, SPC (2003) SBCAPE: Surface Based. Uses the surface temperature and dew point. Will show large diurnal swings. Can give significant overestimates (an order of magnitude) in cases of shallow moisture and underestimates in cases of elevated convection.
Courtesy Peter Banacos, SPC (2003) MLCAPE: Mean Layer. Uses the mean temperature and mean mixing ratio in the lowest part of the atmosphere (SPC uses lowest 100 mb). Less variable in time and space, and more conservative than MUCAPE when lower atmosphere is not well mixed.
Courtesy Peter Banacos, SPC (2003) MUCAPE: Most Unstable Parcel. Uses most unstable parcel in lower atmosphere (SPC uses lowest 300mb). Helps with nocturnal or other types of elevated convection.
What Do I Do With This? ? RUC MUCAPE -March 12, 2006 @ 17Z
What Do I Do With This? NAM MUCAPE - March 12, 2006 @ 17Z
Surface Based Parcels Violent tornado outbreak over western Missouri. KSGF RAOB May 5th, 2003 @ 00Z
Elevated Based Parcels Numerous Reports of Hailin Eastern NE/ Western IA KOAX RAOB May 4th, 2003@ 18Z
CAPE vs. Parcel Selection April 20, 2004 Mean Layer CAPE Surface Based CAPE From Jon Davies Webpage
How Tall is the CAPE? April 20th, 2004 @ 22Z From Jon Davies Webpage (http://members.cox.net/jdavies1/)
How Tall is the CAPE? April 20th, 2004 From Jon Davies Webpage
How Wide Is the CAPE? COMET Larger differences between parcel temperature and the environmental temperature means stronger updrafts that are less susceptible to entrainment.
Lapse Rates • Craven (2000) found in a study of 65 major tornado outbreaks that 6.7o C/km is a useful lower limit. He also found low shear environments that produce tornadoes have steeper lapse rates. • Steep mid level lapse rates (850-500 mb) have more conditional instability and increased CAPE. • Steep low level lapse rates (0-3km AGL) can give a better idea on how quickly convection will develop.
Mid Level Lapse Rates 500mb Heights/500-700mb Lapse Rates -- May 2003 Friday, May 9th @ 12Z
500mb Height/500-700mb Lapse Rates – March 11-12, 2006 Mid Level Lapse Rates Sat Morn – 12Z Sat Eve – 00Z Sun Eve – 00Z Sun Morn – 12Z
Inhibiting Factors • Boustead (2007) theorized that subsidence from a shortwave ridge caused a “null” “High Risk” day in the central Plains in June 1999. 12, 18, & 00Z @ OAX – 06/5-6/1999
Assess Vertical Shear • Distribution of vertical shear will determine dominant thunderstorm type. • Can be determined using either: • Traditional fixed layers (0-6km bulk shear, 0-1km SRH) • “Effective” shear which accounts forsounding dependentinflow layer through CAPE and CIN constraints. (Large sample testing suggests that “effective layer” is best defined by CAPE>100 J/kg and CIN>-250 J/kg. (Thompson 2007)). Effective shear on mesoanaylsis data is dependent on correct RUC soudings. • Low level curvature can determine if right-movers, left-movers, or both kinds of splits are favored.
Storm Type: Ordinary Cells • Dominant Type in Weak Shear Environments • Pulse Type Severe Storms. COMET
Storm Type: Multicells COMET Moderate to strong shear is confined mainlyto the lower levels (0 to 3 km AGL)
Organized Multicells • >40kt 0-6 km shear • >30kt 700-500mb wind • Dry (low theta-e) midlevel air (strong cold pool) • Downshear SBCAPE max • System relative convergence acting downshear to enhance forward propagation
Storm Type: Supercells • Thompson et al. (2003) found that 90% of the 2” diameter hail reports were caused by supercells. • Recent work showed that from only 25% (Trapp et al. 2005) to as few a 3% (Jones et al 2004) of radar-detected mesocyclones were actually associated with tornadoes.
Deep Shear Magnitude • 0-6 km layer shear “thresholds”: • 40+ kts: if storms develop -- supercells are likely (provided convective mode favors cellular activity) • 30-40 kts: supercells also possible if environment is very or extremely unstable as storm can augment local shear (>5,000 J/kg (Burgess (2003)) • About 15-20 kts:shear needed for organized convection (multicell or supercell) with mid level winds at least 25 kt • Supercells become more probable as the effective bulk shear vector increases in magnitude through the range of > 25-40 kts. (Thompson et al., 2004b) • While 0-6km shear is a good discriminator between cell types, it isn’t a good tornado forecast tool (Thompson et al, 2002). • Houston et al. (2008) found in a study that compared 250 non-supercell soundings to 829 supercell soundings that the best fixed layer shear depth to discriminate between the two is 0-5 km.
Deep Shear Magnitude Bunkers et al. 2006 found that in a study of 440 supercells that: • Long-lived supercells (those lasting >4 hrs) occur in environments with much stronger 0-8km bulk wind shear ( > 50 kt) than that observed with short-lived supercells. • Long lived supercells produce notably more F2–F5 tornadoes when compared with short-lived supercells, and a single long-lived supercell can also produce a substantial amount of nontornadic severe weather.
0-6 km Shear Magnitude Supercells Non-Supercells From Thompson et al (2002)
Supercell Composite Parameter (SCP)(Thompson et al, 2004a) The SCP is a multi-parameter index that includes effective SRH, muCAPE, and effect Bulk Shear. Each parameter is normalized to supercell “threshold” values. It is conditional on having discrete storms develop. SCP = (muCAPE / 1000 J kg-1) * (ESRH / 50 m2 s-2) * (EBWD / 20 m s-1) EBWD is divided by 20 m s-1 in the range of 10-20 m s-1. EBWD less than 10 m s-1 is set to zero, and EBWD greater than 20 m s-1 is set to one. (Computed every hour on the SPC Mesoanalysis Page.)
What Causes Supercell Type Rasmussen and Straka (1998) found in an observational study of 43 isolated supercells that supercell type depends on the precipitation efficiency of the storm which is based on its ingestion of hydrometeors.
Classic Supercells • The real “value” of a CL supercell is that it appears to be the most efficient of the three types to produce significant tornadoes. • Can occur nearly anywhere in U.S. when NSE supports them.
High Precipitation (HP) Supercells • Lower mid-level and anvil-relative flow. • Interactions with other storms – “seeding”, more storms can occur with weak caps. • Typically associated with weaker tornadoes, but can produce significant tornadoes (Plainfield IL). • More of a severe wind (Pakwash), hail, and flash flooding threat. • Are the more-common supercell type east of the Mississippi owing to NSE conditions there (weaker caps, etc.), and may be the most common type everywhere in the U.S.
Pond Bank PA Falcon Co Hurr. Opal Cone of Silence Horizontal Dimension “mini” “mini” “large” Vertical Dimension “low-topped” “high-topped” “low-topped” Supercell Dimensions Burgess (2003)
Supercell Movement Bunkers et al (2000) A physically based, shear-relative, and Galilean invariant method based on 290 supercell hodographs.
Supercell Movement Bunkers and Zeitler (2000) • There are some caveats to this method: • Stronger deep-layer vertical wind shear (0-6 km) leads to a stronger mesocyclone and thus to greater deviation from the mean wind. • Weaker mid-level storm-relative winds allow for a stronger cold pool, and thus a tendency for the supercell to move rapidly downshear. • Depth of thunderstorms need to be considered. • Supercell motion can be altered by wind shear from boundaries and orography. • It is surface based. (Thompson, et al., 2007)
What’s the Problem? • Evans and Doswell (2002) noted Strong Forcing Derechoes and discrete, significant tornadic supercells (F2-F5) can occur in similar environments. • Different types of supercells can be found in the same environment. • Thompson and Mead (2006) found in a study of 223 storms over the southern Plains that the probability of significant tornadoes is four times greater with discrete convection over non-discrete. • Thompson et al. (2008) found in a study of 359 significant tornado cases that included 864 individual significant tornadoes that the largest tornado outbreaks (events with >6 F2-F5 tornadoes) were dominated by discrete cells, whereas Quasi-Linear Convective Systems produced 33% of singular events. • Unfortunately, differences can be very subtle and difficult to diagnose operationally.
What Controls Storm Coverage?(Thompson, 2004) • Widespread coverage expected with: • Rich moisture influx and steep lapse rates • Combination of Q-G and mesoscale ascent • (Differential CVA and WAA with surface frontogenesis) • Little CIN (Everything goes up.) • Isolated (or no) storms with: • Marginal moisture and lapse rates (weak CAPE) • Neutral to subsident large-scale environment (Rely on small-scale/shallow processes for initiation) • Large CIN (Confine storms to “strongly forced” or in areas of most persistent ascent) • Bunkers et al. (2006) found in their study of 440 supercells that long lived variety (>4 hrs) tend to occur in medium forced* environments whereas strongly forced events caused more linear or mixed modes of convection.
Supercells or Squall Line? *surface boundaries w/ horizontal temperature gradient of 2.5-5oC/100 km or 300mb jet max of 50-70kts
Initiating Boundary w.r.t. Deep Layer Flow(Bluestein and Weisman, 2000; Dial and Racy, 2004; James et al., 2005) • Parallel: (lines dominate, with end supercells) • 45-60o: (discrete supercells, little storm interaction) • 90o: (colliding storm splits, but depends on storm spacing and hodograph shape)
Progressive Trough May 4th 2003 Tornado Outbreak, Progressive Flow Aloft 0-6 km shear across dryline, and storm motion faster than boundary motion From Rich Thompson, SPC
Progressive Trough March 12th 2006 Tornado Outbreak, Progressive Flow Aloft 0-6 km shear across boundary, and storm motion faster than boundary motion
High Amplitude Trough April 6th 2001 Great Plains “High Risk” Squall Line 0-6 km shear largely parallel to dryline, and storm motion slower than boundary motion From Rich Thompson, SPC
Deep Shear vs. Boundary Orientation(March 11-13, 2006) Sat Eve – 04Z Sun Aftn – 21Z Sun Eve – 00Z Sun Eve – 06Z
Derechoes or Tornadoes? Anvil SR Winds may show some discrimination (Evans 2003).
Surface Pressure Changes • 1-2 hourly pressure changes help identify: • Mesolow /mesohigh couplets and boundaries • Concentrated fall/rise couplet enhance low- level convergence/shear by backing surface winds (enhancing tornado threat) • Clouds associated with surface pressure falls may be linked to a dynamical feature • Implications on thermal advection • Rise/Fall couplets may indicate severe wind threat in marginal CAPE environments
Tornado Parameters • Supercell Tornadoes • Low Level Shear Vector and Storm Relative Helicity • Low Level Thermodynamic Profile • Height of LCL • Low Level CAPE and CIN • Boundaries • Non-Supercell Tornadoes