Severity Exposed -
October 2010. Severity Exposed - . October 2010. Severity Exposed - Putting the jacket back on. Instant vs Homemade – Single Claimant Severity . Severity can arrive a couple of different ways, kind of like oatmeal Instant in the form of a serious catastrophic claim – Burns / Brains

Severity Exposed -
E N D
Presentation Transcript
October 2010 Severity Exposed -
October 2010 Severity Exposed - Putting the jacket back on
Instant vs Homemade – Single Claimant Severity • Severity can arrive a couple of different ways, kind of like oatmeal • Instant in the form of a serious catastrophic claim – Burns / Brains • Homemade / slow cooked via deterioration of reserves and additional health problems of injured workers “in the system” • Unlike oatmeal, unforeseen severity to a portfolio can be unhealthy • A long-term, broad market view of losses will provide some severity indicators • AASCIF provides a great environment for non-competing companies to exchange data, experience and strategies to identify and attempt to mitigate severity volatility • Intermediary and Consultant have tools to help to reveal severity volatility
Guy CarpenterSeverity Indicator / Portfolio Management Tool - Reveal™ • Others may have similar tools. Some of you may have created your own severity tool / index • Reveal™, by Guy Carpenter was created to provide a refined, class code level look at severity beyond Hazard Groupings • What was originally a four tiered system is now seven tiered system – better but still contains some gaps • Computer power and actuarial science have been combined to produce a more refined view of severity • Created with industry data by state • For class codes without the volume to produce credibility, algorithms were created using other state and/or similar class code experience
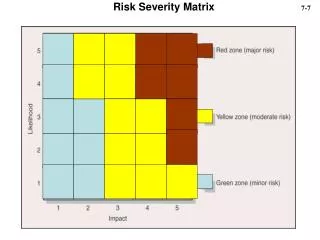
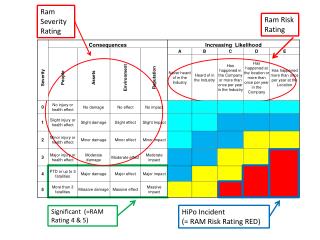
Ratio of Permanent Total Claims to Temporary Total Claims Higher than Hazard Group These Class Codes have a higher relative frequency of 5-7 times the hazard group Lower than Hazard Group Plotting the Class CodesRelative Frequency by Class Code • Individual Class Codes A point plotted near “1” represents a class code that has historically had an “average” number of observed Permanent Total claims, compared to the Hazard Group average. A point significantly above or below has had a disproportionate number of PT claims, compared to the class’s HG average.
Guy CarpenterSeverity Indicator / Portfolio Management Tool - Reveal™ • Both ceding companies and reinsurers tend to rely on Hazard Groups for their severity indicators. • With severity driven class code data on your side you can refine…. • …Underwriting / Loss Control / Claims handling to address severity classes • …/enhance chances of profitability when reviewing growth initiatives • …(change) reinsurer opinions of severity within a portfolio, reduce reinsurance pricing • …indentify pockets of exposure, policies which may warrant strategic reinsurance purchasing (facultative reinsurance)
Reinsurance as a backstopSingle Claimant vs Multiple Claimant losses • Lots of “two’s” in the reinsurance discussion today • Two types of reinsurance Treaty and Facultative • Treaty – reinsurance to cover a portfolio of policies • Facultative – reinsurance to cover losses from a single policy* • Two forms of reinsurance Pro-Rata and Excess of Loss • Pro-rata – first dollar sharing of premium and losses • Excess of Loss – reinsurance pays once a deductible has been exceeded • Two forms of Excess of Loss reinsurance • Multiple claimant coverage – industrial accident, natural perils, terrorism. Also called Catastrophe reinsurance • Single claimant coverage – also called working layer
Reinsurance as a backstopSingle Claimant vs Multiple Claimant losses • Multiple Claimant (Catastrophe) Reinsurance • Several products, ample reinsurance capacity and price flexibility for multi-claimant, Catastrophe reinsurance. • Steady price decreases 2003 • Third-party catastrophe models for earthquake and terrorism create common ground for evaluating loss possibilities • Price is market driven by the market’s cost of capital to cover limits offered • Terms and Conditions typically allow for loss from a single claimant of up to $10M. More is available, but at a price
Reinsurance as a backstopSingle Claimant Coverage • Single Claimant severity exposure is typically mitigated with Working layer reinsurance coverage. • Two typical tranches (if purchased) • Single claimant coverage in layers up to $5M per occurrence • Single claimant losses between $5M and $10M • Very few buy reinsurance excess of $10M although there is capacity available. (watch this space !) • Strength of Ceding company balance sheet, Hazard Group mix, historical losses and risk appetite of Executives and Board usually factor into the decision for working layers structures. • Instant severity and developed (homemade) severity volatility can be covered by the same structures
Reinsurance as a backstopSingle Claimant Coverage • Typical terms and conditions for a working layer providing single claimant coverage • Per Occurrence – determined by the date of loss • Typically a fixed aggregate limits either… • …purchased in advance • …limited by a number of reinstatements, which may result in some additional premium • Usually a sunset provision of seven or ten years • Requires that a claim be reported to reinsurers within the sunset date. • Limits to $10M available • As a part of an overall Enterprise Risk Management strategy, conservative accident year strategies create good calendar year strategies.
Reinsurance as a backstopSingle Claimant Coverage – higher limits • More inquiries from clients for limits greater than $10M • Tough to find middle ground for ceding companies and reinsurers • Possible strategies • Pooling of risk by more than one company to purchase reinsurance • Multi-year agreements for reduced annual limits • Change layering. Update current $5M xs $5M layers to $10M xs $5M • Modify the multi-claimant catastrophe coverages to allow for a single claimant loss greater than $10M (which is typically the cap) • Intermediaries and reinsurers can provide a valuable view of the risk (and mitigating structures) to complement a company’s internal view of the risk of severity volatility
Closing • Additional client stories • 15+ year client – One historical loss greater than $5M. Within three weeks in 2010, one claim $9M one claim $6M. Both single claimant losses • We have a client with a single claimant incurred loss greater than $30M. • Few believe a company can eliminate the possibility of severity loss volatility. However, there are tools and strategies which can reduce dependency on “good luck”
Questions / Discussion Aaron Bueler, Workers Compensation Specialty Practice Leader, Managing Director – Guy Carpenter, Seattle Jason Denechaud, Director of Accident, Health & Workers Compensation Underwriting, Catlin US
October 2010 Severity Exposed - Putting the jacket back on