Calibrating Transmitters Paul Wakeham
Calibrating Transmitters Paul Wakeham. Learning Objectives. Demonstrate converting transmitter input signals to output signals Follow lab procedure without guidance to perform transmitter calibration Document transmitter nameplate data. Operation. % INPUT = % OUTPUT
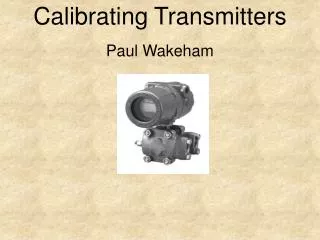

Calibrating Transmitters Paul Wakeham
E N D
Presentation Transcript
LearningObjectives • Demonstrate converting transmitter input signals to output signals • Follow lab procedure without guidance to perform transmitter calibration • Document transmitter nameplate data
Operation % INPUT = % OUTPUT i.e: When input is 75%, Output is 75% TRANSMITTER INPUT OUTPUT
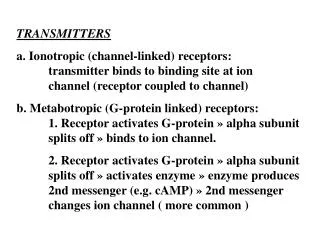
Conversion Formula Range: Always Two values; URV: Upper Range Value LRV: Lower Range Value: 4–20 ma , URV = 20, LRV= 4 Span = 16, URV–LRV (20 –4)
Conversion Formula • Output = % Span x Span + LRV • If input is at 75% of Span Than; • Output = .75 x (20 – 4) + 4 • Output = 8 milliamp
Transmitter Documentation Model and Serial Number Rosemount 1151 - SDP-URD476
Transmitter Documentation Model and Serial Number Rosemount 1151 - SDP-URD476 Range Code Range 4: 150 inH2O
Transmitter Documentation Model and Serial Number Rosemount 1151 - SDP-URD476 Range Code Range 4: 150 in H2O Maximum Working Pressure MWP: 2000 PSI
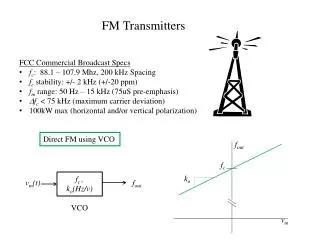
Example Current Loop 2200 ºC ZERO SPAN • Sensor Input • Pressure + – 4 – 20 ma 24 V Loop Supply 2 Wire Transmitter With permission from Fluke Education Partnership Program
Calibration Diagram Manometer 0 –5 Volt Pump 250 ohm H D/P Cell L ma Vent + - 24 volt DC
Calibrating D/P Cell Video • To view the video, click the YouTube link below: http://www.youtube.com/watch?v=Ceg24baacPA
Calibration Summary • % Input = % Output • Output = % Span x Span + LRV • Document All Data • Calibrate to Percent of Error • Output must be Linier