Download
1 / 4
40 likes | 83 Vues
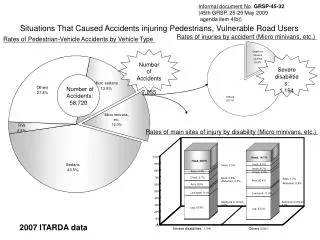
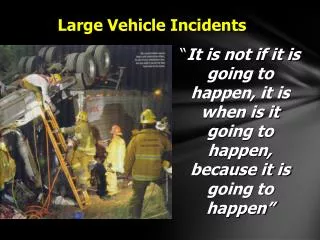
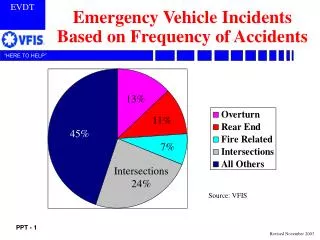
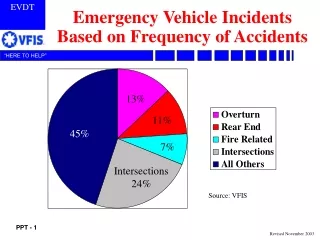
This study analyzes emergency vehicle incidents at intersections based on accident frequency (13%, 11%, 45%, 7%) and severity (13%, 8%, 29%, 5%). Data includes contributing factors, types of response, and percent reported incidents with emergency lights/siren.

E N D
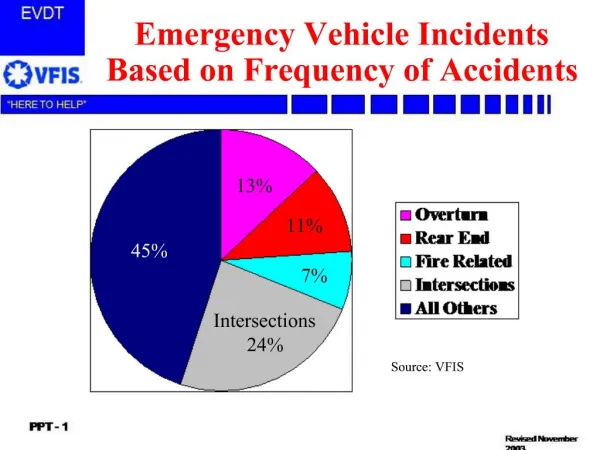
Emergency Vehicle Incidents Based on Frequency of Accidents 13% 11% 45% 7% Intersections 24% Source: VFIS
Emergency Vehicle Incidents Based on Severity of Accidents 13% 8% 29% 5% Intersections 45% Source:VFIS
Contributing Factor 59% 53% 21% 21% 18% 12% 8% 8% Source: VFIS
Intersection Accident Details Type of Response Warning Devices Percent of Reported Incidents Emergency Lights/Siren 68 % Emergency Lights Only 8 % Emergency Neither 2 % Emergency Unknown 1 % Return from Emergency Lights Only 1 % Return from Emergency Neither 2 % Training Neither 1 % Other Neither 5 % Unknown Unknown 12 % Source: VFIS