Download
1 / 31
310 likes | 448 Vues
A comparison of remotely sensed imagery with site-specific crop management data. Anjelien Drost Land Resource Science University of Guelph. Outline. Introduction Objectives Data Acquisition Methodology Results Conclusion. Introduction. Technology in Agriculture.

E N D
A comparison of remotely sensed imagery with site-specific crop management data Anjelien Drost Land Resource Science University of Guelph
Outline • Introduction • Objectives • Data Acquisition • Methodology • Results • Conclusion
Introduction Technology in Agriculture Changes in farming practices due to advent of new technologies: • Global Positioning Systems (GPS) • Yield monitors • Geographic Information Systems (GIS) • Remote Sensing
Introduction Applications These technologies have lead to: • On-the-go yield mapping • GPS soil sampling for nutrient mapping • Variable application of fertilizers • Ability to manage large acreage • GPS field scouting for pests, weeds, disease
Introduction Objectives • to determine the steps involved in analysing CASI imagery for SSCM • to use acquired knowledge of image analysis software (PCI Geomatics) and GIS software (ESRI) to correlate imagery to SSCM data.
Introduction Data Acquisition- Imagery • Compact Airborne Spectragraphic Imager (CASI)
Introduction Data Acquisition- Imagery • False color image
Introduction Data Acquisition- Yield • Grain monitor on a yield combine attached to a differential global positioning system. • Every 1.5m
Introduction Data Acquisition- Soils • 1995 sampling on a 30m grid • Organic matter content, soil texture, pH pH Organic Matter Soil texture
Introduction Data - Standard statistics
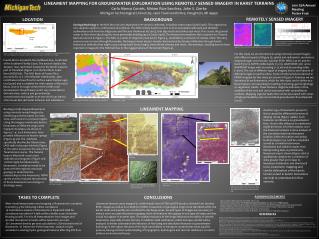
Methodology • Image correction • Unsupervised Classification • Normalized Difference Vegetation Index (NDVI) • Classified surface interpolations • Gridded data points
Unsupervised Classification • K-means unsupervised classification • red, and NIR bands • aggregated into four (high, high-medium, medium-low, low) Place classified image here
NDVI • (NIR -RED)/(NIR + RED) • NDVI * 1000 Place classified image here
Interpolations • Inverse Distance Weighted • Reclassified into classes
Interpolations • Inverse Distance Weighted • Reclassified into classes
Grid Points • Converted points to grid • 3 m resolution • Compared these to NIR and NDVI bands • Pixel to pixel analysis
Results • Comparison of yield to image • classified image to classified yield • classified image to grid yield • NDVI to grid yield • NDVI to classified yield • Comparison of soil properties to image • OM • soil texture • pH
Yield • Classified to classified • R2 = 0.71 • y= 0.76x+0.56
Yield • Gridded yield to classified image • High yield values in class 4 (high) • Low yield values in class 1 (low)
Yield • NDVI values to classified yield • High NDVI values in class 4 (high yield) • Lower NDVI values in class 1 (low yield)
Yield • Gridded yield to NDVI values • R2 = 0.59
Problems • GPS from monitor • yield sensor • crop moisture • interpolation • GPS • sensor calibration • image registration • positional errors • interpolation Instrument Errors Product Georeferenced Yield map Yield Monitor Coregistration errors Spectrographic Imager NDVI Global Positioning System Digital Elevation Model Source: M. Wood et al., 1997
Organic matter content • Interpolated organic matter map
Organic matter content • Organic matter values in classified image
Soil Texture • Interpolated soil texture map
Soil Texture • NDVI distribution in soil texture classes • low NDVI values in fine sandy areas • high NDVI values in loamy soils
Soil Texture • Soil texture class distribution in classified image • Fine sands fall into class 1 and 2 • more loamy soils in class 3 and 4
pH • Interpolated pH map
pH • pH distribution in classified image • higher pH in class 4
SSCM Conclusions • One image provides quite accurate insight into crop yield variability • Can use NDVI or classified image for interpretation • Imagery is also an indicator of the variability of soil properties • always remember sources of error • Imagery has the potential to predict yield variability