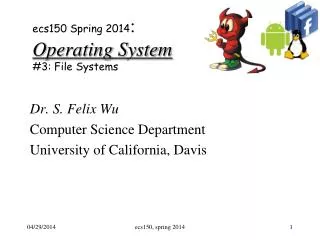
CS 505: Computer Structures Memory and Disk I/O
CS 505: Computer Structures Memory and Disk I/O. Thu D. Nguyen Spring 2005 Computer Science Rutgers University. Main Memory Background. Performance of Main Memory: Latency: Cache Miss Penalty Access Time: time between request and word arrives Cycle Time: time between requests

CS 505: Computer Structures Memory and Disk I/O
E N D
Presentation Transcript
CS 505: Computer StructuresMemory and Disk I/O Thu D. Nguyen Spring 2005 Computer Science Rutgers University
Main Memory Background • Performance of Main Memory: • Latency: Cache Miss Penalty • Access Time: time between request and word arrives • Cycle Time: time between requests • Bandwidth: I/O & Large Block Miss Penalty (L2) • Main Memory is DRAM: Dynamic Random Access Memory • Dynamic since needs to be refreshed periodically (8 ms) • Addresses divided into 2 halves (Memory as a 2D matrix): • RAS or Row Access Strobe • CAS or Column Access Strobe • Cache uses SRAM: Static Random Access Memory • No refresh (6 transistors/bit vs. 1 transistor) • Size: DRAM/SRAM 4-8 • Cost/Cycle time: SRAM/DRAM 8-16
DRAM logical organization (4 Mbit) Column Decoder … D Sense Amps & I/O 1 1 Q Memory Array A0…A1 0 (2,048 x 2,048) Storage W ord Line Cell
4 Key DRAM Timing Parameters • tRAC: minimum time from RAS line falling to the valid data output. • Quoted as the speed of a DRAM when buy • A typical 4Mb DRAM tRAC = 60 ns • tRC: minimum time from the start of one row access to the start of the next. • tRC = 110 ns for a 4Mbit DRAM with a tRAC of 60 ns • tCAC: minimum time from CAS line falling to valid data output. • 15 ns for a 4Mbit DRAM with a tRAC of 60 ns • tPC: minimum time from the start of one column access to the start of the next. • 35 ns for a 4Mbit DRAM with a tRAC of 60 ns
DRAM Performance • A 60 ns (tRAC) DRAM can • perform a row access only every 110 ns (tRC) • perform column access (tCAC) in 15 ns, but time between column accesses is at least 35 ns (tPC). • In practice, external address delays and turning around buses make it 40 to 50 ns • These times do not include the time to drive the addresses off the microprocessor nor the memory controller overhead!
DRAM History • DRAMs: capacity +60%/yr, cost –30%/yr • 2.5X cells/area, 1.5X die size in 3 years • ‘98 DRAM fab line costs $2B • DRAM only: density, leakage v. speed • Rely on increasing no. of computers & memory per computer (60% market) • SIMM or DIMM is replaceable unit => computers use any generation DRAM • Commodity, second source industry => high volume, low profit, conservative • Little organization innovation in 20 years • Order of importance: 1) Cost/bit 2) Capacity • First RAMBUS: 10X BW, +30% cost => little impact
More esoteric Storage Technologies? • Tunneling Magnetic Junction RAM (TMJ-RAM): • Speed of SRAM, density of DRAM, non-volatile (no refresh) • New field called “Spintronics”: combination of quantum spin and electronics • Same technology used in high-density disk-drives • MEMs storage devices: • Large magnetic “sled” floating on top of lots of little read/write heads • Micromechanical actuators move the sled back and forth over the heads
MEMS-based Storage • Magnetic “sled” floats on array of read/write heads • Approx 250 Gbit/in2 • Data rates:IBM: 250 MB/s w 1000 headsCMU: 3.1 MB/s w 400 heads • Electrostatic actuators move media around to align it with heads • Sweep sled ±50m in < 0.5s • Capacity estimated to be in the 1-10GB in 10cm2 See Ganger et all: http://www.lcs.ece.cmu.edu/research/MEMS
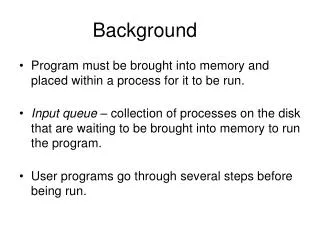
Main Memory Performance • Simple: • CPU, Cache, Bus, Memory same width (32 or 64 bits) • Wide: • CPU/Mux 1 word; Mux/Cache, Bus, Memory N words (Alpha: 64 bits & 256 bits; UtraSPARC 512) • Interleaved: • CPU, Cache, Bus 1 word: Memory N Modules(4 Modules); example is word interleaved
Main Memory Performance • Timing model (word size is 32 bits) • 1 to send address, • 6 access time, 1 to send data • Cache Block is 4 words • Simple M.P. = 4 x (1+6+1) = 32 • Wide M.P. = 1 + 6 + 1 = 8 • Interleaved M.P. = 1 + 6 + 4x1 = 11
How Many Banks? • Number of banks Number of clock cycles to access word in bank • otherwise will return to original bank before it can have next word ready • Increasing DRAM size => fewer chips => harder to have banks
32 8 8 2 4 1 8 2 4 1 8 2 DRAMs per PC over Time DRAM Generation ‘86 ‘89 ‘92 ‘96 ‘99 ‘02 1 Mb 4 Mb 16 Mb 64 Mb 256 Mb 1 Gb 4 MB 8 MB 16 MB 32 MB 64 MB 128 MB 256 MB 16 4 Minimum Memory Size
Avoiding Bank Conflicts • Lots of banks int x[256][512]; for (j = 0; j < 512; j = j+1) for (i = 0; i < 256; i = i+1) x[i][j] = 2 * x[i][j]; • Even with 128 banks, since 512 is multiple of 128, conflict on word accesses • SW: loop interchange or declaring array not power of 2 (“array padding”) • HW: Prime number of banks • bank number = address mod number of banks • address within bank = address / number of words in bank • modulo & divide per memory access with prime no. banks? • address within bank = address mod number words in bank • bank number? easy if 2N words per bank
Fast Memory Systems: DRAM specific • Multiple CAS accesses: several names (page mode) • Extended Data Out (EDO): 30% faster in page mode • New DRAMs to address gap; what will they cost, will they survive? • RAMBUS: startup company; reinvent DRAM interface • Each Chip a module vs. slice of memory • Short bus between CPU and chips • Does own refresh • Variable amount of data returned • 1 byte / 2 ns (500 MB/s per chip) • Synchronous DRAM: 2 banks on chip, a clock signal to DRAM, transfer synchronous to system clock (66 - 150 MHz) • Niche memory or main memory? • e.g., Video RAM for frame buffers, DRAM + fast serial output
PotentialDRAM Crossroads? • After 20 years of 4X every 3 years, running into wall? (64Mb - 1 Gb) • How can keep $1B fab lines full if buy fewer DRAMs per computer? • Cost/bit –30%/yr if stop 4X/3 yr? • What will happen to $40B/yr DRAM industry?
Main Memory Summary • Wider Memory • Interleaved Memory: for sequential or independent accesses • Avoiding bank conflicts: SW & HW • DRAM specific optimizations: page mode & Specialty DRAM • DRAM future less rosy?
Virtual Memory: TB (TLB) CPU CPU CPU VA VA VA VA Tags PA Tags $ TB $ TB VA PA PA L2 $ TB $ MEM PA PA MEM MEM Overlap $ access with VA translation: requires $ index to remain invariant across translation Conventional Organization Virtually Addressed Cache Translate only on miss Synonym Problem
2. Fast hits by Avoiding Address Translation • Send virtual address to cache? Called Virtually Addressed Cacheor just Virtual Cache vs. Physical Cache • Every time process is switched logically must flush the cache; otherwise get false hits • Cost is time to flush + “compulsory” misses from empty cache • Dealing with aliases(sometimes called synonyms); Two different virtual addresses map to same physical address • I/O must interact with cache, so need virtual address • Solution to aliases • One possible solution in Wang et al.’s paper • Solution to cache flush • Addprocess identifier tagthat identifies process as well as address within process: can’t get a hit if wrong process
2. Fast Cache Hits by Avoiding Translation: Process ID impact • Black is uniprocess • Light Gray is multiprocess when flush cache • Dark Gray is multiprocess when use Process ID tag • Y axis: Miss Rates up to 20% • X axis: Cache size from 2 KB to 1024 KB
2. Fast Cache Hits by Avoiding Translation: Index with Physical Portion of Address • If index is physical part of address, can start tag access in parallel with translation so that can compare to physical tag • Limits cache to page size: what if want bigger caches and uses same trick? • Higher associativity one solution Page Address Page Offset Address Tag Block Offset Index
Alpha 21064 • Separate Instr & Data TLB & Caches • TLBs fully associative • TLB updates in SW(“Priv Arch Libr”) • Caches 8KB direct mapped, write thru • Critical 8 bytes first • Prefetch instr. stream buffer • 2 MB L2 cache, direct mapped, WB (off-chip) • 256 bit path to main memory, 4 x 64-bit modules • Victim Buffer: to give read priority over write • 4 entry write buffer between D$ & L2$ Instr Data Write Buffer Stream Buffer Victim Buffer
Alpha CPI Components • Instruction stall: branch mispredict (green); • Data cache (blue); Instruction cache (yellow); L2$ (pink) Other: compute + reg conflicts, structural conflicts
Pitfall: Predicting Cache Performance from Different Prog. (ISA, compiler, ...) • 4KB Data cache miss rate 8%,12%, or 28%? • 1KB Instr cache miss rate 0%,3%,or 10%? • Alpha vs. MIPS for 8KB Data $:17% vs. 10% • Why 2X Alpha v. MIPS? D$, Tom D$, gcc D$, esp I$, gcc I$, esp I$, Tom
Pitfall: Simulating Too Small an Address Trace I$ = 4 KB, B=16B D$ = 4 KB, B=16B L2 = 512 KB, B=128B MP = 12, 200
Main Memory Summary • Wider Memory • Interleaved Memory: for sequential or independent accesses • Avoiding bank conflicts: SW & HW • DRAM specific optimizations: page mode & Specialty DRAM • DRAM future less rosy?
Outline • Disk Basics • Disk History • Disk options in 2000 • Disk fallacies and performance • Tapes • RAID
Inner Track Outer Track Sector Head Arm Platter Actuator Disk Device Terminology • Several platters, with information recorded magnetically on both surfaces (usually) • Bits recorded in tracks, which in turn divided into sectors (e.g., 512 Bytes) • Actuator moves head (end of arm,1/surface) over track (“seek”), select surface, wait for sector rotate under head, then read or write • “Cylinder”: all tracks under heads
{ Platters (12) Photo of Disk Head, Arm, Actuator Spindle Arm Head Actuator
Disk Device Performance Inner Track Outer Track Sector Head Controller Arm Spindle • Disk Latency = Seek Time + Rotation Time + Transfer Time + Controller Overhead • Seek Time? depends no. tracks move arm, seek speed of disk • Rotation Time? depends on speed disk rotates, how far sector is from head • Transfer Time? depends on data rate (bandwidth) of disk (bit density), size of request Platter Actuator
Disk Device Performance • Average distance sector from head? • 1/2 time of a rotation • 7200 Revolutions Per Minute = 120 Rev/sec • 1 revolution = 1/120 sec = 8.33 milliseconds • 1/2 rotation (revolution) = 4.16 ms • Average no. tracks move arm? • Sum all possible seek distances from all possible tracks / # possible • Assumes average seek distance is random • Disk industry standard benchmark
Data Rate: Inner vs. Outer Tracks • To keep things simple, orginally kept same number of sectors per track • Since outer track longer, lower bits per inch • Competition decided to keep BPI the same for all tracks (“constant bit density”) • More capacity per disk • More of sectors per track towards edge • Since disk spins at constant speed, outer tracks have faster data rate • Bandwidth outer track 1.7X inner track!
Response time = Queue + Controller + Seek + Rot + Xfer Service time Devices: Magnetic Disks Track Sector • Purpose: • Long-term, nonvolatile storage • Large, inexpensive, slow level in the storage hierarchy • Characteristics: • Seek Time (~8 ms avg) • Transfer rate • 10-30 MByte/sec • Blocks • Capacity • Gigabytes • Quadruples every 3 years (aerodynamics) Cylinder Platter Head 7200 RPM = 120 RPS => 8 ms per rev ave rot. latency = 4 ms 128 sectors per track => 0.25 ms per sector 1 KB per sector => 16 MB / s
Historical Perspective • 1956 IBM Ramac — early 1970s Winchester • Developed for mainframe computers, proprietary interfaces • Steady shrink in form factor: 27 in. to 14 in. • 1970s developments • 5.25 inch floppy disk formfactor (microcode into mainframe) • early emergence of industry standard disk interfaces • ST506, SASI, SMD, ESDI • Early 1980s • PCs and first generation workstations • Mid 1980s • Client/server computing • Centralized storage on file server • accelerates disk downsizing: 8 inch to 5.25 inch • Mass market disk drives become a reality • industry standards: SCSI, IPI, IDE • 5.25 inch drives for standalone PCs, End of proprietary interfaces
Disk History Data density Mbit/sq. in. Capacity of Unit Shown Megabytes 1973: 1. 7 Mbit/sq. in 140 MBytes 1979: 7. 7 Mbit/sq. in 2,300 MBytes source: New York Times, 2/23/98, page C3, “Makers of disk drives crowd even more data into even smaller spaces”
Historical Perspective • Late 1980s/Early 1990s: • Laptops, notebooks, (palmtops) • 3.5 inch, 2.5 inch, (1.8 inch formfactors) • Formfactor plus capacity drives market, not so much performance • Recently Bandwidth improving at 40%/ year • Challenged by DRAM, flash RAM in PCMCIA cards • still expensive, Intel promises but doesn’t deliver • unattractive MBytes per cubic inch • Optical disk fails on performance but finds niche (CD ROM)
Disk History 1989: 63 Mbit/sq. in 60,000 MBytes 1997: 1450 Mbit/sq. in 2300 MBytes 1997: 3090 Mbit/sq. in 8100 MBytes source: New York Times, 2/23/98, page C3, “Makers of disk drives crowd even mroe data into even smaller spaces”
1 inch disk drive! • 2000 IBM MicroDrive: • 1.7” x 1.4” x 0.2” • 1 GB, 3600 RPM, 5 MB/s, 15 ms seek • Digital camera, PalmPC? • 2006 MicroDrive? • 9 GB, 50 MB/s! • Assuming it finds a niche in a successful product • Assuming past trends continue
Disk Performance Model /Trends • Capacity • + 100%/year (2X / 1.0 yrs) • Transfer rate (BW) • + 40%/year (2X / 2.0 yrs) • Rotation + Seek time • – 8%/ year (1/2 in 10 yrs) • MB/$ • > 100%/year (2X / <1.5 yrs) • Fewer chips + areal density
Latency = Queuing Time + Controller time + Seek Time + Rotation Time + Size / Bandwidth { per access + per byte State of the Art: Ultrastar 72ZX • 73.4 GB, 3.5 inch disk • 2¢/MB • 10,000 RPM; 3 ms = 1/2 rotation • 11 platters, 22 surfaces • 15,110 cylinders • 7 Gbit/sq. in. areal den • 17 watts (idle) • 0.1 ms controller time • 5.3 ms avg. seek • 50 to 29 MB/s(internal) Track Sector Cylinder Track Buffer Arm Platter Head source: www.ibm.com; www.pricewatch.com; 2/14/00
Disk Performance Example • Calculate time to read 1 sector (512B) for UltraStar 72 using advertised performance; sector is on outer track • Disk latency = average seek time + average rotational delay + transfer time + controller overhead • = 5.3 ms + 0.5 * 1/(10000 RPM) + 0.5 KB / (50 MB/s) + 0.15 ms • = 5.3 ms + 0.5 /(10000 RPM/(60000ms/M)) + 0.5 KB / (50 KB/ms) + 0.15 ms • = 5.3 + 3.0 + 0.10 + 0.15 ms = 8.55 ms
Areal Density • Bits recorded along a track • Metric is Bits Per Inch (BPI) • Number of tracks per surface • Metric is Tracks Per Inch (TPI) • Care about bit density per unit area • Metric is Bits Per Square Inch • Called Areal Density • Areal Density = BPI x TPI
Areal Density • Areal Density =BPI x TPI • Change slope 30%/yr to 60%/yr about 1991
Technology Trends Disk Capacity now doubles every 12 months; before 1990 every 36 motnhs • Today: Processing Power Doubles Every 18 months • Today: Memory Size Doubles Every 18-24 months(4X/3yr) • Today: Disk Capacity Doubles Every 12-18 months • Disk Positioning Rate (Seek + Rotate) Doubles Every Ten Years! The I/O GAP
Fallacy: Use Data Sheet “Average Seek” Time • Manufacturers needed standard for fair comparison (“benchmark”) • Calculate all seeks from all tracks, divide by number of seeks => “average” • Real average would be based on how data laid out on disk, where seek in real applications, then measure performance • Usually, tend to seek to tracks nearby, not to random track • Rule of Thumb: observed average seek time is typically about 1/4 to 1/3 of quoted seek time (i.e., 3X-4X faster) • UltraStar 72 avg. seek: 5.3 ms => 1.7 ms
Fallacy: Use Data Sheet Transfer Rate • Manufacturers quote the speed of the data rate off the surface of the disk • Sectors contain an error detection and correction field (can be 20% of sector size) plus sector number as well as data • There are gaps between sectors on track • Rule of Thumb: disks deliver about 3/4 of internal media rate (1.3X slower) for data • For example, UlstraStar 72 quotes 50 to 29 MB/s internal media rate • => Expect 37 to 22 MB/s user data rate