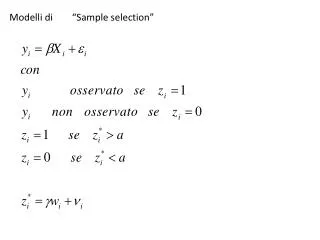
Modelli di “Sample selection”
Modelli di “Sample selection”. Il processo generatore dei dati dipende da una variabile (z) NON implicata nel modello “sostanziale”, a sua volta determinata da un insieme di fattori

Modelli di “Sample selection”
E N D
Presentation Transcript
Il processo generatore dei dati dipende da una variabile (z) NON implicata nel modello “sostanziale”, a sua volta determinata da un insieme di fattori Modo di rappresentazione dei processi di selezione non casuale, come è ovvio la distorsione dipende dalla correlazione tra z e y In altri termini viene specificato un primo modello (1) che rappresenta “il disegno”, cioè il processo di selezione delle unità e un secondo modello (2) che è quello d’interesse:
Momenti: Se z e y appartengono ad una NORMALE BIVARIATA:
Modello di regressione E’ come se si omettesse una variabile
Due alternative per la stima: • Massima verosimiglianza • Si tratta di specificare la distribuzione CONGIUNTA e massimizzare la verosimiglinaza per i parametri β, , u,, • 2. Two step (Heckmann), stima in due tempi: • Probit per il processo di selezione • Calcolo dei • OLS per il modello “sostanziale” con aggiunta di tra le dipendenti
Example 24.9 A Mover-Stayer Model for Migration The model of migration analyzed by Nakosteen and Zimmer (1980). The equations of the model are net benefit of moving: M∗i = wi γ + ui , income if moves: Ii 1 = xi 1β1 + εi 1, income if stays: Ii 0 = xi 0β0 + εi 0. One component of the net benefit is the market wage individuals could achieve if they move, compared with what they could obtain if they stay. Therefore, among the determinants of the net benefit are factors that also affect the income received in either place. An analysis of income in a sample of migrants must account for the incidental truncation of the mover’s income on a positive net benefit. Likewise, the income of the stayer is truncated on a nonpositive net benefit. The model implies an income after moving for all observations, but we observe it only for those who actually do move.
They applied the selectivity model to a sample of 9,223 individuals with data for 2 years (1971 and 1973). Over the period, 1,078 individuals migrated and the remaining 8,145 did not. The independent variables in the migration equation were as follows: SE = self-employment dummy variable; 1 if yes, EMP = rate of growth of state employment, PCI = growth of state per capita income, x = age, race (nonwhite=1), sex (female=1), SIC = 1 if individual changes industry. The earnings equations included SIC and SE. Results are given in Table 24.4. The figures in parentheses are t ratios. Considerato il processo di selezione e l’eterogeneità delle var.indip, La differenza è dicirca 500 dollari (1973)
Un applicazione importante è la stima dei treatment effects e la valutazione di interventi ad esempio sul reddito Un equazione che descrive l’effetto sul reddito di una laurea (ad esempio) è Redditoi= xiβ + δCi+ εi , Dove Ciè una dummy che indica presenza/assenza di laurea. La domanda è: δ misura il “valore della laurea” (assumendo che il resto del modello sia correttamente specificato)? La risposta è NO se chi si laurea ha comunque la capacità di ottenere redditi più alti sia che sia laureato o no! C’è un problema di auto-selezione. Se queste ipotesi sono corrette la stima OLS di δ sovrastima l’effetto. Questo vale in qualunque contesto in cui è il soggetto a scegliere il trattamento.
Il processo generatore dei dati è: Quindi la stima corretta sarà: Per i laureati: Per i non laureati: E quindi la differenza corretta sarà: