Download

1 / 27
270 likes | 472 Vues
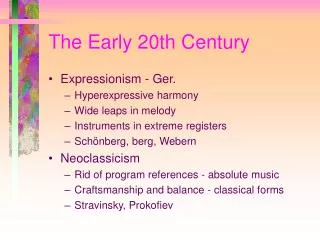
Reanalysis of the 20th Century. Gilbert P. Compo, Jeffrey S. Whitaker, and Prashant D. Sardeshmukh Univ. of Colorado/CIRES Climate Diagnostics Center and NOAA Earth System Research Laboratory/PSD. Special thanks to N. Matsui, R. Vose, R. Allan, S. Woodruff.

E N D
Reanalysis of the 20th Century Gilbert P. Compo, Jeffrey S. Whitaker, and Prashant D. Sardeshmukh Univ. of Colorado/CIRES Climate Diagnostics Center and NOAA Earth System Research Laboratory/PSD Special thanks to N. Matsui, R. Vose, R. Allan, S. Woodruff
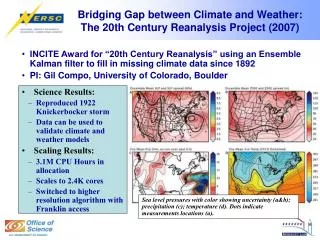
The 20th Century Reanalysis Project Summary: An international collaborative project led by NOAA and CIRES to produce high-quality tropospheric reanalyses for the last 100 years using only surface observations. The reanalyses will provide: -First-ever estimates of near-surface and tropospheric 6-hourly fields extending back to the beginning of the 20th century; -Estimates of biases and uncertainties in the basic reanalyses; -Estimates of biases and uncertainties in derived quantities (storm tracks, etc.) Initial product will have higher quality in the Northern Hemisphere than in the Southern Hemisphere. US Department of Energy INCITE computing award and NOAA Climate Program Office support to produce 1892-2007 by early 2009. Initially produce 1908-1958.
Ensemble Filter Algorithm • xjb = <x>b + x’jb= first guess jth ensemble member ( j=1,…,56 ) • yo = single observation with error variance R • First guess interpolated to observation location: • <y>b = H<x>b , y’jb = Hx’jb • Form analysis ensemblexja = <x>a + x’jafrom • <x>a = <x>b + K ( yo - <y>b ) • x’ja = x’jb + KM (-y’jb ) Note the different gain • K = Sj x’jb y’jb (Sj y’jb y’jb + R)-1 Kalman Gain • KM = (1 + {R/(Sj y’jb y’jb + R)} –1/2 )-1 K Modified Kalman Gain • shrinks the ensemble • (1/(n-1)) is included in Sj • Analysis ensemble becomes first guess ensemble for next observation. Using 56 member Ensemble Filter T62 (about 2 degree), 28 level NCEP CFS03 model HadISST monthly boundary conditions (Rayner et al. 2003)
All Union Research Institute of Hydrometeorological Information WDC Atmospheric Reconstructions over the Earth Australian Bureau of Meteorology British Antarctic Survey Danish Meteorological Institute Deutscher Wetterdienst EMULATE Environment Canada ETH-Zurich GCOS AOPC/OOPC Working Group on Surface Pressure Hong Kong Observatory ICOADS Instituto Geofisico da Universidade do Porto Japanese Meteorological Agency Jersey Met Dept. KNMI MeteoFrance Meteorological and Hydrological Service, Croatia National Center for Atmospheric Research NOAA Climate Database Modernization Program NOAA Earth System Research Laboratory NOAA National Climatic Data Center NOAA National Centers for Environmental Prediction NOAA Northeast Regional Climate Center at Cornell U. NOAA Midwest Regional Climate Center at UIUC Norwegian Meteorological Institute Ohio State U. – Byrd Polar Research Center Proudman Oceanographic Laboratory SIGN - Signatures of environmental change in the observations of the Geophysical Institutes South African Weather Service UK Met Office Hadley Centre U. of Colorado-CIRES/Climate Diagnostics Center U. of East Anglia-Climatic Research Unit U. of Lisbon-Instituto Geofisico do Infante D. Luiz U. of Lisbon- Instituto de Meteorologia U. of Milan-IFGA U. Rovira i Virgili-CCRG International Surface Pressure Databank Subdaily observations assembled under GCOS AOPC/OOPC Working Group on Surface Pressure GCOS/WCRP Working Group on Observational Data Sets for Reanalysis NOAA NCDC, NOAA ESRL, and CU/CIRES: merging station data NOAA ESRL and NCAR (ICOADS): merging marine data Thank you to partners contributing observations:
Sea Level Pressure analyses for Tri-State Tornado Outbreak of 18 March 1925(deadliest tornado in U.S. history) Manual Analysis, courtesy C. Doswell Ensemble mean from Ensemble Filter (4 hPa interval, 1010 hPa thick) NOTE!!! This analysis did not use ANY of the observations shown on the left.
Range of possibilities for Sea Level Pressure 18 March 1925 18Z using 14 (of 56) members Ensemble of 56 possible realizations consistent with the observations
1 December 1918 1 December 1925 1 December 1935 1 December 1945 SLP SLP SLP SLP 500 hPa GPH 500 hPa GPH 500 hPa GPH 500 hPa GPH Analysis Ensemble Mean and Spreadon selected dates in the 1918-1945 reanalysis period Sea Level Pressure 500 hPa Geopotential Height Contours- ensemble mean Shading- blue: more uncertain, white: more certain
Uncertainty estimate poleward of 20Nblueactual differenceredexpected difference Nobs
Correlation = 0.97 0.9 0.7 0.5 Observed Anomaly 0.3 N = 7106 Analyzed Anomaly Day-3, Day-5, Day-7 500 mb Z anomaly correlation forecast skill from NCEP and ECMWF (Sept-Oct 2007) Analyzed 500 mb Z compared with independent radiosonde obs (1935-1956) Day 3 Pattern Correlation September-October 2007 0.96 - 0.97 Median Absolute Error = 22.4 m Expected Error = 21.5 m* * Assumes observation error of 20 m (courtesy S. Bronniman and A. Grant, ETH) Reanalysis skill is comparable to current Day-3 forecast skill !
300 hPa Geopotential Height Verification using independent radiosonde observations (1935-1956) Correlation = 0.94 Median Abs Error = 39 m Expected Error = 37 m* * Assumes observation error of 35 m N = 6619 (courtesy S. Bronniman and A. Grant, ETH)
Summary • Accuracy: Mid-tropospheric NH fields about as accurate as current 3-day forecasts. • Uses: • Effectively doubling the reanalysis record length • Climate model validation dataset for large-scale synoptic anomalies during extreme periods, such as droughts (30’s, 50’s) and extreme tornado outbreaks. • Better understand events such as the 1920-1940’s Arctic warming. • Timeline: 1908-1958 done, full 1892-present done by Spring 2009. • Data Access: Will be freely available from NCAR, NOAA/ESRL and NOAA/NCDC. 1908-1958 in Fall 2008. 1892-2007 in Spring 2009. • 1850-2007, Partnering with GCOS Working Group on Surface Pressure, GCOS/WCRP Working Group on Observational Datasets for Reanalysis, Atmospheric Circulation Reconstructions over the Earth, RECLAIM, NOAA/CDMP, many National and University surface pressure data recovery efforts. • For status updates, email • jeffrey.s.whitaker@noaa.gov, • gilbert.p.compo@noaa.gov, or compo@colorado.edu
2009-2011: Early to mid-19th Century Reanalysis (with DoE and NOAA support) Version 3: mid-19th – 21st century would need all data by August 2010 improved version of NCEP model at higher resolution => hurricanes, high impact phenomena? potentially available in 2012 Future plans with ACRE
Obstacles to Improving Reanalyses of the 19th to 21st Centuries • Model Error • Need improved representation of errors and unresolved processes (stochastic parameterization) • Petascale Computing power • Need higher resolution for mesoscale extremes, e.g., hurricanes • Additional observations needed • Millions of land and marine observations not yet recovered or exchanged • Working with partners in Met Services, Universities, and international initiatives such as ACRE, NOAA CDMP, GEOSS/GCOS, IEDRO, RECLAIM, WCRP, WMO DARE
Effect of HURDAT data on Sept 1938 “Long Island Express” ISPD only ISPD plus HURDAT-derived pressure
Any Skill Forecasting the Track? 36 hour forecast verifying 21 Sept 1938 18Z using 56 ensemble members T254L64 (about 0.5 degree)
Summary • Accuracy: Mid-tropospheric NH fields about as accurate as current 3-day forecasts. • Uses: • Effectively doubling the reanalysis record length • Climate model validation dataset for large-scale synoptic anomalies during extreme periods, such as droughts (30’s, 50’s) and extreme tornado outbreaks. • Better understand events such as the 1920-1940’s Arctic warming. • Timeline: 1908-1958 done, full 1892-present done by Spring 2009. • Data Access: Will be freely available from NCAR, NOAA/ESRL and NOAA/NCDC. 1908-1958 in Spring 2008. 1892-2007 in Spring 2009. • 1850-2007, Partnering with GCOS Working Group on Surface Pressure, GCOS/WCRP Working Group on Observational Datasets for Reanalysis, Atmospheric Circulation Reconstructions over the Earth (Rob Allan at the UK Hadley Centre), RECLAIM, NOAA/CDMP, many National and University surface pressure data recovery efforts. • For status updates, email • jeffrey.s.whitaker@noaa.gov, • gilbert.p.compo@noaa.gov, or compo@colorado.edu
1 December 1935 SLP 500 hPa GPH Analysis Ensemble Mean and Spreadon selected dates in the 1935-1945 reanalysis period Sea Level Pressure 500 hPa Geopotential Height Contours- ensemble mean Shading- blue: more uncertain, white: more certain
1 December 1945 SLP 500 hPa GPH Analysis Ensemble Mean and Spreadon selected dates in the 1935-1945 reanalysis period Sea Level Pressure 500 hPa Geopotential Height Contours- ensemble mean Shading- blue: more uncertain, white: more certain
Anom Corr = 0.87 Anom Corr = 0.90 T700 Verification - Independent Obs(courtesy S. Bronniman and A. Grant, ETH) MAE = 1.58 K Expected Error = 1.71 K* MAE = 1.59 K Expected Error = 1.73 K* * Assumes observation error of 1.5 K
Uncertainty estimate poleward of 20Nblueactual differenceredexpected difference Nobs
L L L Sea Level Pressure Analyses26 - 27 December 1947 Intensity of East Coast Low is weaker in Ensemble Filter analyses, but major features are present. Contour interval is 4 hPa in all panels and 1012 hPa contour is thickened. (Kocin and Uccellini, 2004) US Weather Bureau Ensemble Filter
Air Weather Service analysis valid 0400GMT NCEP T254 3 hr forecast valid 0600GMT Ensemble Filter T62 analysis valid 0600GMT Severe snowstorm case in New York City, USA. Analyses of 500 hPa Geopotential Height27 December 1947 Using only surface pressure observations, Ensemble Filter analysis compares well with analyses using upper-air observations. Using all available surface and upper-air obs 5500 m (18000 ft) contour is thickened Using only surface pressure obs
RMS error of 6-hourly 500 mb Z analyses for Jan-Feb 2005 using ECWMF 3DVARand only Surface Pressure observations at 1930’s densities Northern Hemisphere Analysis Error ECWMF System Retuned for only surface pressure ECWMF2005 T159L64 Courtesy J.Thepaut
Northern Hemisphere Analysis Error RMS error of 6-hourly 500 mb Z analyses for Jan-Feb 2005 using ECWMF 3DVAR, 4DVAR, NOAA/CIRES Ensemble Data Assimilationand only Surface Pressure observations at 1930’s densities ECWMF System Retuned for only surface pressure Need system tailored for Climate Reanalyses ECWMF2005 T159L64 Courtesy J.Thepaut
Effect of HURDAT data at on Sept 1938 “Long Island Express” No HURDAT data
Effect of HURDAT data on Sept 1938 “Long Island Express” With HURDAT data