Fourier Interpolation
Fourier Interpolation. Fourier Interpolation

Fourier Interpolation
E N D
Presentation Transcript
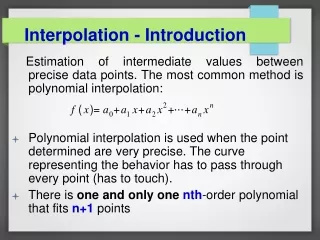
Fourier Interpolation • The Fourier Method of Interpolation is a way a interpolating data that uses combinations of sin(px) and cos(px) where p is an integer. This method of interpolation has several major advantages over polynomial interpolation that we have previously studied. • 1. This will be able data that occurs in cycles more naturally than polynomial interpolation. This is especially useful in modeling certain physical phenomenon such as temperature, thermal and electrical energy. • 2. When it is applied to more than one variable it does not restrict the data being modeled to be a function like Newton’s and Lagrange’s methods. • Trigonometric Polynomials • A trigonometric polynomial of degree m (am0 or bm0) is a polynomial of the form:
Data Sets for Fourier Interpolation Data for Fourier Interpolation is always assumes to be at evenly spaced intervals of the independent variable (we usually refer to as t). For ease of calculation we will assume the variable t is in the half closed interval [0,2). The data set with n data items is usually given in the form {x0, x1, x2, …,xn-1}, but it really represents the data: Degree of a Trigonometric Interpolating Polynomial For a data set of the with n data above the degree of the polynomial depends on if n is even or odd. If m is the degree of the trigonometric polynomial the relation between n and m is that: n = 2m+1 (if n is odd) and n = 2m (if n is even) For example the data set {1,3,-5,2} will be of degree 2 (i.e. n = 4) while {1,3,-5,2,6,-1,4} will be of degree 3 (n = 7).
Interpolating Polynomials Because of the distinction between even and odd the interpolating polynomials take on two different forms. One if the data set has an even number of data items another if it is odd. This is the form if n (the number of data points) is odd: This is the form if n (the number of data points) is even (notice the am term): In either case the aj and bj terms are given by:
Example: Let’s use a Fourier Interpolation of the data {1,3,-5,2} This gives n=4 so m=4/2=2 as before. We begin by computing a0, a1, a2, b1, b2. (Notice from the formula we can assume b0 is always 0.) The interpolating polynomial is:
Algorithm for Fourier Interpolation of data set {x0, x1, x2, …,xn-1}. If Mod[n,2]==0 then m = n/2 else m = (n-1)/2 cossum=0 sinsum=0 For[j=0, jm, j++, ajsum = 0 bjsum = 0 For[k=0, k(n-1), k++, ajsum = ajsum + xk Cos[j(2k)/n] bjsum = bjsum + xk Sin[j(2k)/n]] If j==0 then ajsum = ajsum/2 If j==m and Mod[n,2]==0 then ajsum=ajsum/2 cossum=cossum+ajsum*(2/n)Cos[jt] sinsum=sinsum+bjsum*(2/n)Sin[jt]] f(t) = cossum + sinsum