Download
1 / 24
240 likes | 390 Vues
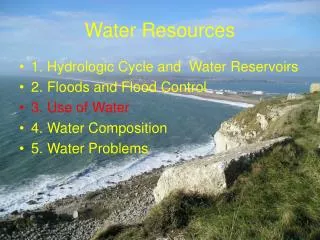
Water Resources. 1. Hydrologic Cycle and Water Reservoirs 2. Floods and Flood Control 3. Use of Water 4. Water Composition 5. Water Problems. Withdrawal vs Consumption. Consumed Evaporated Transpired Incorporated into crops Consumed by humans or livestock

E N D
Water Resources • 1.Hydrologic Cycle and Water Reservoirs • 2. Floods and Flood Control • 3. Use of Water • 4. Water Composition • 5. Water Problems
Withdrawal vs Consumption • Consumed • Evaporated • Transpired • Incorporated into crops • Consumed by humans or livestock • consumptive use—the part of water withdrawn that is evaporated, transpired, incorporated into products or crops, consumed by humans or livestock, or otherwise removed from the immediate water environment.
Types of withdrawal • Domestic-commercial • Industrial-Mining • Thermoelectric power • Irrigation—some use for livestock • Consumptive-use estimates were included in some previous water-use Circulars but were omitted for 2000. Also referred to as water consumed.
Who uses the most water in the US? • California • Texas • The least ? • Alaska • Dependent on population and agriculture
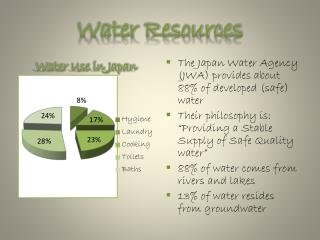
Water Use UK UK water resource use by industry, 1997/98 - Total abstraction: 16.8 billion cubic metres
Annual Renewable Water Supply http://earthtrends.wri.org/maps_spatial/maps_detail_static.php?map_select=265&theme=4
How do you get water to cities? • 1st stream channels were altered or extended to flow into more accessible areas • Greeks built masonry structures and made tunnels to move water • Romans built aqueducts—by A.D. 97 they had 9 aqueducts that brought 322 million liters a day to Rome
Irrigation • Within the U.S. differs from east to west: about 5% in the east is used for irrigation, 90% of water use in west is for irrigation. The water used in irrigation accounts for 85% of all the water consumed in the U.S.
Industrial Use • For processing, washing, and cooling • Most water is returned to the system, however we need to concerned about the quality: industrial pollution and heat pollution
Thermoelectric power • Water used in the generation of electricty from fossil fuels, nuclear and geothermal sources • About 98% of the water is returned to system, but it is hotter than it should be
Hydroelectric Power • Total average flow in all U.S. rivers is 1270 Bgal/day • Total instream hydroelectric power use: about 3300 Bgal/day • How does that work?
World water usage http://www.worldmapper.org/
Water Resources • 1.Hydrologic Cycle and Water Reservoirs • 2. Floods and Flood Control • 3. Use of Water • 4. Water Composition • 5. Water Problems
Water Composition • “Pure spring water” • About 30 ppm of dissolved material 0.003% • Dead sea/Great Salt Lake • About 300,000 ppm or 30% • Ocean Water • 35,000 ppm or 3.5%
Water for human consumption • Should have less than 500 ppm dissolved salts • Water with > 2000 ppm is unsuitable for most other uses (perhaps cooling would be ok—but not irrigation)
Rainwater from Menlo Pk, and average from sites in N.C. and Virginia • Calcium 0.8 0.65 • Magnesium 1.2 0.14 • Sodium 9.4 0.56 • Potassium - 0.11 • Bicarbonate 4 - • Sulfate 7.6 2.2 • Chloride 17 0.57 • Silica 0.3 - • TDS 38 4.7 • pH 5.5 - • Values in PPM
World Poor Water www.worldmapper.org