Download

1 / 13
130 likes | 263 Vues
ESTIMATION OF RIVER DISCHARGE WITH MODIS IMAGES. The University of Tokyo, Institute of Industrial Science (IIS) Kohei Hashimoto and Kazuo Oki. Background.

E N D
ESTIMATION OF RIVER DISCHARGE WITH MODIS IMAGES The University of Tokyo, Institute of Industrial Science (IIS) Kohei Hashimoto and Kazuo Oki
Background • The transport of sediment by water in rivers plays an important role in hydrology and the ecological functioning of river floodplains and deltas. • River discharge estimation is useful for demonstrate these information. • In addition, if low-cost and continuous river discharge estimation becomes available, • It is expected that communities with fewer financial resources such as those in developing countries could easily use this information for constructing effective flood control infrastructure such as dams and levees
Background • One measure generally used for recognizing sediment transport is suspended sediment concentration (SSC). • Satellite remote-sensing technology is useful in tracking spatial and temporal variations in SSC • Many researches attempting remote sensing of SSC have constructed empirical relationships between reflectance and in situ measurements monitored at the same time in the field. • In addition, suspended sediment concentrations (SSC) normally show a robust empirical relationship with such hydraulic flow parameters as discharge and velocity. (e.g. L-Q equation) • These facts raise the possibility of directly estimating river discharge or velocity from reflectance remotely sensed by satellite.
Objective of study • In this study, MODIS images are used for estimating river discharge. MODIS images are taken every day and can be used for free. Problems: • Although it is an advantage of observation by MODIS that it can take images once a day, the narrow width of target rivers means that the spatial resolution of this sensor is too low (250m in band 1) to extract reflectance data directly from the pixel corresponding to the place in situ discharge observations have taken place. To solve the problem: • In this study, we extracted MODIS band 1 reflectance values from a pixel near the river mouth. Objects: • To carry out the regression analysis between the reflectance values and the in situ discharge data that were gathered the same days the satellite images were taken. • To evaluate monthly and annual average discharge estimated from the MODIS reflectance with the regression model.
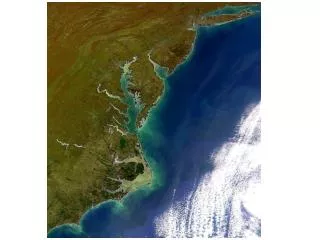
Study Area and Used Data • Naka river and (b) Monobe river of MODIS images Point A: All in situ measurements of river discharge were corrected by MLIT. In both rivers, discharge data were taken once a day throughout 2004. MLIT: Ministry of Land, Infrastructure, Transport and Tourism Point B: In this study, we extracted MODIS band 1 reflectance values from a pixel near the river mouth
Used MODIS data at Naka and Monobe Rivers • *Level 1B images were used • (radiometrically and geometrically corrected ).
Simple Atmospheric Correction • In this study, we used simple atmospheric correction for L1B data. • As reference data, the offshore data, which is assumed as no reflectance data, were used. • The reference from original data is subtracted. Collected area of Offshore data
Method • spatial resolution is too low (250m in band 1)… • Extract the reflectance values from a pixel near the river mouth at point B. • apply single regression analysis to reflectance values and natural logarithm of in situ discharge.
Results <Naka River (2004)> RMS = 213.0381 RMS = 199.4644
Results <Monobe River (2004)> RMS = 73.62537 RMS = 76.16806
Relationship between observed and estimated monthly discharge Observed monthly discharge(m3/s) Observed monthly discharge(m3/s) RMS = 157.4799 RMS = 157.4799 RMS = 35.38131 Estimated monthly discharge(m3/s) Estimated monthly discharge(m3/s)
Conclusions • In this study, we extracted MODIS band 1 reflectance values from a pixel near the river mouth (point B in Figure),then applied single regression analysis to reflectance values and the in situ discharge data that were gathered the same days the satellite images were taken. • Our method proved effective to estimate the discharge with MODIS data at narrow river.