Download
1 / 20
200 likes | 344 Vues
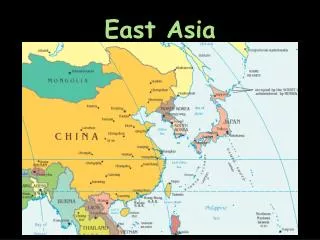
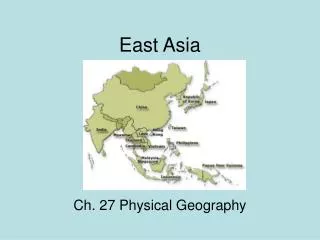
East Asia. Regional Statistics Source: CIA. Area of Region. Total (sq mi) 4,552,799 Land 4,445,576 Water 107 ,223 Arable Land 437,988 Permanent Crops 3,288 Permanent Pastures 2,086,208 Forests & Woodlands 745,931

E N D
East Asia Regional Statistics Source: CIA
Area of Region • Total (sq mi) 4,552,799 • Land 4,445,576 • Water 107,223 • Arable Land 437,988 • Permanent Crops 3,288 • Permanent Pastures 2,086,208 • Forests & Woodlands 745,931 • Other 1,279,413 • Irrigated 222,539
Population for Region • Total 1,495,234,743 • 0-14 years (%) 23.38 • 15-64 years (%) 68.24 • 65 years and over (%) 8.38 • Population growth rate (%) 1.03
Births & Deaths for Region • Birth rate/1000 15.49 • Death rate/1000 6.39 • Net migration rate/1000 1.22 • Infant mortality rate/1000 18.30 • Life expectancy at birth-total population (years) 74.37 • Total fertility rate (children born/woman) TFR 1.81
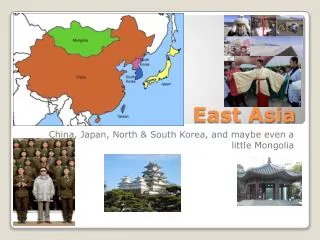
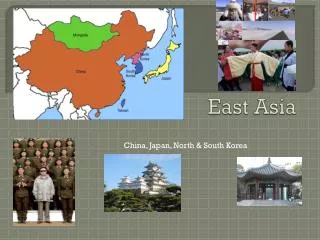
Ethnicity of Region • China • Han Chinese 91.9%, Zhuang, Uygur, Hui, Yi, Tibetan, Miao, Manchu, Mongol, Buyi, Korean, and other nationalities 8.1% • Macau • Chinese 95%, Macanese (mixed Portuguese and Asian ancestry), Portuguese, other • Japan • Japanese 99.4%, Korean 0.6%
Ethnicity of Region • North Korea • racially homogeneous; there is a small Chinese community and a few ethnic Japanese • South Korea • homogeneous (except for about 20,000 Chinese)
Ethnicity of Region • Mongolia • Mongol (predominantly Khalkha) 85%, Turkic (of which Kazakh is the largest group) 7%, Tungusic 4.6%, other (including Chinese and Russian) 3.4% • Taiwan • Taiwanese (including Hakka) 84%, mainland Chinese 14%, aborigine 2%
Religions of Region • China • Daoist (Taoist), Buddhist, Muslim 2%-3%, Christian 1% (est.) • Japan • observe both Shinto and Buddhist 84%, other 16% (including Christian 0.7%) • Macau • Buddhist 50%, Roman Catholic 15%, none and other 35%
Religions of Region • North Korea • traditionally Buddhist and Confucianist, some Christian and syncretic Chondogyo (Religion of the Heavenly Way) • note: autonomous religious activities now almost nonexistent; government-sponsored religious groups exist to provide illusion of religious freedom • South Korea • Christian 49%, Buddhist 47%, Confucianist 3%, Shamanist, Chondogyo (Religion of the Heavenly Way), and other 1%
Religions of Region • Mongolia • Tibetan Buddhist Lamaism 96%, Muslim (primarily in the southwest), Shamanism, and Christian 4% (1998) • Taiwan • mixture of Buddhist, Confucian, and Taoist 93%, Christian 4.5%, other 2.5%
Languages of Region • China • Standard Chinese or Mandarin (Putonghua, based on the Beijing dialect), Yue (Cantonese), Wu (Shanghaiese), Minbei (Fuzhou), Minnan (Hokkien-Taiwanese), Xiang, Gan, Hakka dialects, minority languages • Literacy Rate (%) 99.5 • Japan • Japanese • Literacy Rate (%) 99.0
Languages of Region • North Korea • Korean • Literacy Rate (%) 98.0 • South Korea • Korean, English widely taught in junior high and high school • Literacy Rate (%) 99.0 • Macau • Portuguese, Chinese (Cantonese) • Literacy Rate (%) 90.0
Languages of Region • Mongolia • Khalkha Mongol 90%, Turkic, Russian • Literacy Rate (%) 97.0 • Taiwan • Mandarin Chinese (official), Taiwanese (Min), Hakka dialects • Literacy Rate (%) 94.0
Economy of Region • GDP ($) $8,835,000,000 • GDP - real growth rate (%) 3 • GDP - per capita ($) $11,754.00 • GDP-agriculture (%) 13.0 • GDP-industry (%) 35.0 • GDP-services (%) 51.0 • Labor force 116,000,000 • Unemployment rate (%) 4.0
Miscellaneous • Telephones - main lines in use (M) 235.25 • Telephones - mobile/cellular (M) 242.11 • Radios (M) 594.68 • Televisions (M) 512.62 • ISPs 102 • Airports 925