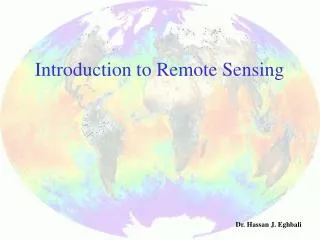
Introduction to Remote Sensing
Introduction to Remote Sensing. Cons 340. Lab Review. Connect to a folder Make sure your default geodatabase is the one you are working on Save your map document in your workspace (where your geodatabase lives). Project management. Be organized

Introduction to Remote Sensing
E N D
Presentation Transcript
Introduction to Remote Sensing Cons 340
Lab Review • Connect to a folder • Make sure your default geodatabase is the one you are working on • Save your map document in your workspace (where your geodatabase lives)
Project management • Be organized • Lots of data from lots of sources – it’s easy to get lost • Develop good habits early on • Verify the validity of your data • Read metadata first • Check GCS and projection • Use a consistent file/directory naming convention
The Basics • An “image” is digital as opposed to a “picture” which you take with a camera • Images are made up of Pixels which is short for Picture Elements • Pixels contain values (numbers) • The more Pixels etc. the larger the image file size
File Structure • Common file formats: • JPEG Joint Photographic Experts Group • TIFF Tag Image File Format • GIF Graphics Interchange Format • BMP Bitmap File • PICT Macintosh Picture File • TGA Targa Image File • Graphics files typically have a header (file format info) and then a table of numbers that represent pixel values as seen on the right
Pixels and Color Depth • Each pixel has numerous values associated with it • The # of bits in a value defines the color depth of the image • 1 bit = 2 colors • 8 bits = 256 colors • 16 bits = 65k colors (hi-color) • 24 bit = 16 million colors (true-color) • As color depth increases the space required for the image’s storage increases as well
Color Spaces • RGB (Red-Green-Blue; Additive) • CMY (Cyan-Magenta-Yellow; Subtractive) • CMYK (Cyan-Magenta-Yellow-Black) • HSV (Hue-Saturation-Value) • Grayscale (Shades of Gray) • 1-bit (line art; only two colors i.e. Black and White) Equivalent RGB, CMY, and HSV values
RGB (Red-Green-Blue) • An RGB image is comprised of three layers • RGB is an additive color space, meaning that pixel values are added to black to create new colors
CMYK (Cyan-Magenta-Yellow-Black) • A CMYK image is comprised of four layers • CMYK is a subtractive color space, meaning that pixel values are subtracted from white to create new colors
Image Dimensions • Referred to as (Horizontal dimension by Vertical dimension) • (200 x 340) or (100 x 170) • Relates to the size of the image in bytes • 200 x 300 = 200 Kb • 100 x 170 = 50 Kb
Resolution (DPI) • DPI = Dots per Inch • The greater the DPI per equivalent areas the greater the image’s file size • Average screen resolution is 72 DPI • Typical printer resolution is 300 DPI
Spatial Resolution • When an image refers to something in the “real world” we say it has Spatial Resolution • This refers to the unit of measure in the “real world” that a pixel represents in the image • e.g. 30 meter Digital Elevation Models (DEM)
Which brings us to Remote Sensing(and a selection of major RS programs) http://www.ersc.wisc.edu/resources/EOSC.html
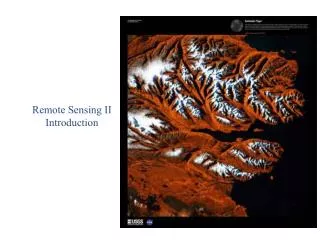
Examples This one-meter resolution satellite image of Manhattan, New York was collected at 11:43 a.m. EDT on Sept. 12, 2001 by Space Imaging's IKONOS satellite. IKONOS travels 423 miles above the Earth's surface at a speed of 17,500 miles per hour.
Land surface from satellite • Four landsat-5 Thematic Mapper multispectral image mosaic displayed in 4,3,2-RGB (false color) • August 2nd and 27th, 1998, 10:15a.m. pst. • 16 day repeat, 30m
Ocean Color • SeaWiFs classified ocean color image with unclassified land surface displayed 6,3,2-RGB • August 16th, 1999 • Daily, 1km
Time series One year of daily AVHRR at 1km of the Amazon Basin
A Remote Sensing System • Energy source • platform • sensor • data recording / transmission • ground receiving station • data processing • expert interpretation / data users
Basic Concepts: EM Spectrum l 1 nm, 1mm, 1m f 3x10¹⁷ Hz, 3x10¹¹ Hz, 3x10⁸ Hz, Sometime use frequency, f = c / l, where c = 3x10⁸ m/s (speed of light)
You are a remote sensing platform! And your eyes are the sensors
Airborne Platforms Aerial platforms are primarily stable wing aircraft, although helicopters are occasionally used. • Aircraft are often used to collect very detailed images and facilitate the collection of data over virtually any portion of the Earth's surface at any time.
Satellite Platforms • In space, remote sensing is sometimes conducted from the space shuttle or, more commonly, from satellites. • Because of their orbits, satellites permit repetitive coverage of the Earth's surface on a continuing basis. • Cost is often a significant factor in choosing among the various platform options.
Geostationary Orbit • geostationary (36 000 km altitude)
Near-Polar Orbit • polar orbiting (200-1000 km altitude)
The Business End of RS (and for that matter your Digital Camera or Camcorder) MERIS(MEdium Resolution Image Spectrometer Instrument) charge-coupled device (CCD) Many of these put together in a grid is referred to as a CCD Array
Radar • real aperture radar • microwave • energy emitted across-track • return time measured • amount of energy (scattering) • synthetic aperture radar • microwave • higher resolution - extended antenna simulated by forward motion of platform • ERS-1, -2 SAR (AMI), Radarsat SAR, JERS SAR
Band Combinations 3,2,1 4,3,2 5,4,3
Spatial data resolution problem • trade-off pixel size vs. spatial coverage • quantization and data volume • data merge from different sources • grid displacement in time • information content of different resolutions • raster-vector conversion
Multi-resolution merging20m Multi-spectral + 10m PAN of SPOT
Image Processing
Simple IP Techniques • These techniques are accomplished by applying mathematical algorithms to individual pixel values • e.g. Brightness simply adds a constant value to each pixel
Convolution Filters • A matrix of multipliers that is applied to each pixel as it is moved across the image • They are typically moved from left to right as you would read a book
Examples of Convolution Filters at work • (a) Input image • (b) Laplacian of (a) • (c) sum of (a) and (b) • (d) Sobel gradient of (a) smoothed by a 5x5 box filter • (e) Product of (b) and (d) • (f) sum of (a) and (e)