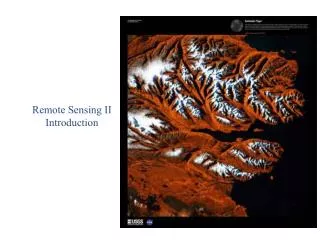
Introduction to Remote Sensing
Introduction to Remote Sensing. Stan Kidder COMET Faculty Course Boulder, CO August 9, 2011 kidder@cira.colostate.edu. 1. Introduction.

Introduction to Remote Sensing
E N D
Presentation Transcript
Introduction to Remote Sensing Stan Kidder COMET Faculty Course Boulder, CO August 9, 2011 kidder@cira.colostate.edu 1
Introduction • In order to correctly interpret weather satellite images, or to develop algorithms to retrieve quantities from their data, one must have an idea of where the radiation sensed by the satellite originated. • For most satellite instruments of interest to forecasters, the images appear to capture radiation emitted by the surface or clouds. • However, this emitted radiation must travel through the atmosphere, where at least part of it is absorbed and where the air molecules emit their own radiation. • This is the realm of a field called radiative transfer, that is, the transfer of electromagnetic radiation through the atmosphere. 2
What Do Satellites Measure? • Electromagnetic radiation • That’s all, just electromagnetic radiation 3
Blackbody Radiation • All things emit radiation • The “perfect emitter” of radiation is called a blackbody. It emits radiation according to the Planck function: 4
Blackbody Radiation • A hotter blackbody emits more radiation at all wavelengths than does a cooler blackbody • All blackbodies have a peak in radiation which decreases in wavelength () as T increases. Source Source 5
Non-blackbodies • Real objects are less-than-perfect emitters. They emit where 0 ≤ ελ ≤ 1 • ελ is a strong function of wavelength (and the composition of the emitter). 6
Non-blackbodies • If aλ is the fraction of radiation incident on a body that is absorbed, thenThat is, a body is exactly as good an absorber as an emitter at every wavelength. 7
Non-blackbodies • Energy is conserved, so that radiation incident on a body is either absorbed by the body (aλ), transmitted through the body (τ λ), or reflected by the body (ρλ): 8
Non-blackbodies • In the infrared portion of the spectrum, for most surfaces, ελ is in the 0.9–1.0 range; that is, most surfaces, including land, water, and clouds, are good blackbodies. • A perfect blackbody transmits no radiation and reflects no radiation. Therefore, it absorbs all radiation incident on in and appears “black.” 9
Back to the Satellite View Satellite receives εoBλ(To) τo A fraction τogets through the atmosphere εoBλ(To) leaves the surface 10
The Atmosphere Emits Radiation Also • If the layer were a black body, it would emit radiance B(Ti), where Ti is the temperature of the layer. • Since the layer is not a perfect blackbody it really emits εiBλ(Ti), where εi is the emittance(0 εi 1) of the layer. • A fraction of this emitted radiation τi (0 τi 1) reaches the satellite. 13
The Radiative Transfer Equation Putting this all together, we can write the radiance that the satellite actually measures L = εoB(To)τo + εiBλ(Ti)τi. where the first term on the right is the surface contribution, and the second term on the right is the sum of the contributions for all of the atmospheric layers. This equation, usually written as an integral, is the radiative transfer equation. Surface Term Atmospheric Term 14
The Weighting Function At this point, it is customary to define Wi as Wiεiτi. and to call Wi the weighting function because it “weights” (multiplies) the blackbody emission Bλ(Ti) of layer i in the radiative transfer equation. More important than the name, however, is that the weighting function tells us how well the satellite “sees” a particular layer of the atmosphere. It is exactly what we need to know to determine where the radiation that the satellite measures comes from. 15
Shape of the Weighting Function • If one chooses height or the logarithm of pressure (which is nearly the same as height) as the vertical coordinate, weighting functions have nearly a Gaussian shape, at least for those channels which do not sense the surface. 16
Shape of the Weighting Function • The transmittance increases with height because at higher altitudes there are fewer absorbing molecules between the layer and the satellite. • The emittance decreases with height because at higher altitudes there are fewer molecules to emit radiation (see below). 17
Shape of the Weighting Function • The product reaches a peak somewhere, though for surface sensing channels, the peak is below the surface. The peak of the weighing function is at the level that is best sensed by the satellite. 18
Shape of the Weighting Function • Above the peak of the weighting function, the satellite doesn't sense the atmosphere as well because there are fewer emitting molecules. • Below the peak, the emitted radiation is mostly absorbed by the atmosphere above. 19
Shape of the Weighting Function • Unfortunately, weighting functions are broad vertically, that is, they sample a thick layer of the atmosphere, which smooths out the fine structure of the vertical temperature (or moisture) profile. 20
The Connection with Absorbing Gas Molecules Absorbing molecules The emittance of a layer can be calculated as the product of two things: ni, the number of molecules of absorbing gas per square meter in layer i, and ai, the absorption cross sectional area of each gas molecule, i.e. εi = niai Of course, ai is a strong function of wavelength and of the type of gas. In fact, if more than one absorbing gas is present in a layer, than we must add all the contribution of each gas: Cross section of radiation beam 21
Sounding the Atmosphere By changing the wavelength, we can move the peak of the weighting function up and down in the atmosphere. By choosing a set of wavelengths which have weighting function peaks that vertically sample the atmosphere, we can get information about the vertical structure of the atmosphere. By inverting the radiative transfer equation, we can retrieve information about this structure. This is known as sounding. One difficulty is that because the weighting functions are broad, fine detail in the vertical temperature structure is lost. Note that as one changes wavelengths so that the atmosphere is more transparent, the weighting function peak moves down in the atmosphere, but the shape of the weighting function doesn't change. Eventually, the peak of the weighting function would be below the surface. This explains why surface-sensing (window) channels have an exponential shape. In truth, these weighting functions are the same as other weighting functions, but their peak is below the surface. 22
Solar Radiation • Solar radiation is slightly different because neither the Earth nor the atmosphere emit radiation at solar wavelengths • At solar wavelengths, radiative transfer is dominated by reflection (scattering) and absorption. Earth Solar Overlap region 23
Solar Radiation τ1 τ2 ρsurface 24
Solar Radiation τ1 τ2 ρcloud 25
Let’s look at some algorithms • Nearly all satellite retrieval algorithms exploit some spectral feature of the atmosphere or surface • The best source of information about an algorithm is the Algorithm Theoretical Basis Document (ATBD). • GOES-R products: http://www.goes-r.gov/products/list.html 26
Example: Sea Surface Temperature • The 12 m channel is more affected by water vapor than the 11 m channel • A quick correction can be found:SST ≈ T11 + k(T11 – T12) • Often physics is used to justify regression equations or other mathematical techniques, which become the official algorithm (see ATBD) 27
Example: Cloud-Top Height • The 11.2, 12.3, and 13.3 m channels are used to nail down the cloud-top temperature, accounting for the emissivity of the cloudand for absorption above the cloud • In a model sounding, the height of the cloud-top temperature is found and used as the height of the cloud top Z Zc T Tc 29
Example: Total Ozone • Uses 6.15, 7.0, 7.4, 9.7, 10.35, 11.2, 12.3, and 13.3 m and model temperature profiles • The basic idea is that if you know the temperature of the layers where the ozone lives, you can calculate how much ozone is there 31
Example: Total Ozone • Uses a regression equation based on a training data set 32
Physics-Assisted Imagery • Forecasters can’t look at an ever-increasing number of channels • Combining channels in clever ways can yield products which are not quite “retrievals,” but which provide useful physical information in a “compact” format • Example from yesterday’s lecture:http://products.cira.colostate.edu/MSG • VIS/SW/IR RGB imagery:http://rammb.cira.colostate.edu/ramsdis/online/goes-west_goes-east.asp • Tropical imagery example:http://products.cira.colostate.edu/GOES-SA/goes.htm 34
Blended Products • No one observing system provides all the data that forecasters need • Combining data from different systems can yield a more complete view • Examples • Blended TPW and Blended Rain Rate:http://cat.cira.colostate.edu • Experimental Blended TPW:http://cat.cira.colostate.edu/bTPW 35