Introduction to Remote Sensing
710 likes | 1.11k Vues
Introduction to Remote Sensing. Dr. Mathias (Mat) Disney UCL Geography Office: 301, 3rd Floor, Chandler House Tel: 7670 4290 Email: mdisney@ucl.geog.ac.uk www.geog.ucl.ac.uk/~mdisney. Format of the course. Course outline Lectures for first part of session, practicals second part

Introduction to Remote Sensing
E N D
Presentation Transcript
Introduction to Remote Sensing Dr. Mathias (Mat) Disney UCL Geography Office: 301, 3rd Floor, Chandler House Tel: 7670 4290 Email: mdisney@ucl.geog.ac.uk www.geog.ucl.ac.uk/~mdisney
Format of the course • Course outline • Lectures for first part of session, practicals second part • Course mark 70% for exam, 30% for write-up of final practical, to be handed in by the end of term (Weds Mar 23rd?) • First week familiarise ourselves with lab PCs and sources of image data on the web • Next 3 practicals 2 weeks each (expect you to spend time on this outside Monday session) • Final practical (Classification): 3 weeks, write-up
Course material • Books • Jensen, J. R. (2000) Remote Sensing of the Environment: An Earth Resource Perspective, 2000, Prentice Hall, New Jersey. (Excellent on RS but no image processing, around £40 from Waterstones). • Jensen, J. R. (2005, 3rd ed.) Introductory Digital Image Processing, Prentice Hall, New Jersey. (Companion to above, around £40 from Waterstones) BUT mostly available online at http://www.cla.sc.edu/geog/rslab/751/index.html • Lillesand, T.M., Kiefer, R.W. and Chipman, J. W. (2004, 5th ed.) Remote Sensing and ImageInterpretation, John Wiley, New York. (good all-round text-book around £35). • Mather, P.M. (1999) Computer Processing of Remotely‑sensedImages, 2nd Edition. John Wiley and Sons, Chichester. • Campbell, J.B. (1996) Introduction to Remote Sensing (2nd Ed),London:Taylor and Francis.
Course material • Web • Tutorials • http://rst.gsfc.nasa.gov/Front/tofc.html • http://mercator.upc.es/nicktutorial/TofC/table.html • http://earth.esa.int/applications/data_util/SARDOCS/spaceborne/Radar_Courses/ • http://www.crisp.nus.edu.sg/~research/tutorial/image.htm • http://www.ccrs.nrcan.gc.ca/ccrs/learn/tutorials/fundam/fundam_e.html • http://octopus.gma.org/surfing/satellites/index.html • Glossary of alphabet soup acronyms! http://www.ccrs.nrcan.gc.ca/ccrs/learn/terms/glossary/glossary_e.html • Other resources • NASA www.nasa.gov • NASAs Visible Earth (source of data): http://visibleearth.nasa.gov/ • European Space Agency www.esa.int • NOAA www.noaa.gov • Remote sensing and Photogrammetry Society UK www.rspsoc.org
Format of the course • Course outline • Lecture 1: Introduction to EO • Lecture 2: Introduction to image processing (image display/enhancement) - practical 1 • Lecture 3: Introduction to electromagnetic spectrum • Lecture 4: Image arithmetic: ratios and spectral indices - practical 2 • Lecture 5: EM spectrum and the atmosphere, plus angular info. • Lecture 6: Information extraction: spatial filtering and classification - practical 3 (assessed practical) • Lecture 7: Spatial, spectral, temporal resolution and tradeoffs • Lecture 8: Orbits, swaths and coverage • Lecture 9: Pre-processing stages and sensor scanning mechanisms • Lecture 10: Applications plus recap
Lecture outline • General introduction to remote sensing (RS), Earth Observation (EO)....... • definitions of RS • Why do we do it? • Applications and issues • Who and where? • Concepts and terms • remote sensing process, end-to-end
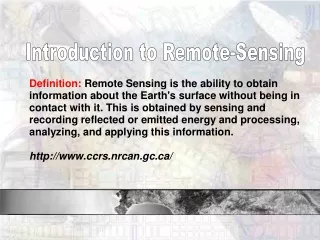
What is remote sensing? The Experts say "Remote Sensing is...” • ...techniques for collecting image or other forms of data about an object from measurements made at a distance from the object, and the processing and analysis of the data (RESORS, CCRS). • ”...the science (and to some extent, art) of acquiring information about the Earth's surface without actually being in contact with it. This is done by sensing and recording reflected or emitted energy and processing, analyzing, and applying that information.” http://www.ccrs.nrcan.gc.ca/ccrs/learn/tutorials/fundam/chapter1/chapter1_1_e.html
What is remote sensing (II)? The not so experts say "Remote Sensing is...” • Advanced colouring-in. • Seeing what can't be seen, then convincing someone that you're right. • Being as far away from your object of study as possible and getting the computer to handle the numbers. • Legitimised voyeurism (more of the same from http://www.ccrs.nrcan.gc.ca/ccrs/eduref/misc)
Remote Sensing Examples • First aerial photo credited to Frenchman Felix Tournachon in Bievre Valley, 1858. • Boston from balloon (oldest preserved aerial photo), 1860, by James Wallace Black.
Remote Sensing Examples • Kites (still used!) Panorama of San Francisco, 1906. • Up to 9 large kites used to carry camera weighing 23kg.
Remote Sensing: scales and platforms • Not always big/expensive equipment • Individual/small groups • Calibration/validation campaigns
Remote Sensing: scales and platforms • Both taken via kite aerial photography • http://arch.ced.berkeley.edu/kap/kaptoc.html • http://activetectonics.la.asu.edu/Fires_and_Floods/
upscale upscale upscale http://www-imk.fzk.de:8080/imk2/mipas-b/mipas-b.htm Remote Sensing: scales and platforms • Platform depends on application • What information do we want? • How much detail? • What type of detail?
Remote Sensing: scales and platforms • E.g. aerial photography • From multimap.com • Most of UK • Cost? Time?
upscale Remote Sensing: scales and platforms • Many types of satellite • Different orbits, instruments, applications
Remote Sensing Examples • Global maps of vegetation from MODIS instrument
Remote Sensing Examples • Global maps of sea surface temperature and land surface reflectance from MODIS instrument
Remote sensing applications • Environmental: climate, ecosystem, hazard mapping and monitoring, vegetation, carbon cycle, oceans, ice • Commercial: telecomms, agriculture, geology and petroleum, mapping • Military: reconnaissance, mapping, navigation (GPS) • Weather monitoring and prediction • Many, many more
EO process in summary..... • Collection of data • Some type of remotely measured signal • Electromagnetic radiation of some form • Transformation of signal into something useful • Information extraction • Use of information to answer a question or confirm/contradict a hypothesis
Statement of problem Data collection Data analysis Presentation of information • What information do we want? • Appropriate problem-solving approach? • In situ: field, lab, ancillary data (Meteorology? Historical? Other?) • EO data: Type? Resolution? Cost? Availability? • Pre/post processing? • Analog: visual, expert interp. • Digital: spatial, photogrammetric, spectral etc. • Modelling: prediction & understanding • Information extraction • Products: images, maps, thematic maps, databases etc. • Models: parameters and predictions • Quantify: error & uncertainty analysis • Graphs and statistics Remote sensing process: I Formulate hypothesis Hypothesis testing
Passive: solar reflected/emitted Active:RADAR (backscattered); LiDAR (reflected) The Remote Sensing Process: II • Collection of information about an object without coming into physical contact with that object
The Remote Sensing Process: III • What are we collecting? • Electromagnetic radiation (EMR) • What is the source? • Solar radiation • passive - reflected, emitted • OR artificial source • active - RADAR, LiDAR
Electromagnetic radiation? • Electric field (E) • Magnetic field (M) • Perpendicular and travel at velocity, c (3x10⁸ ms-1)
Energy radiated from sun (or active sensor) • Energy 1/wavelength (1/) • shorter (higher f) == higher energy • longer (lower f) == lower energy from http://rst.gsfc.nasa.gov/Intro/Part2_4.html
Information • What type of information are we trying to get at? • What information is available from RS? • Spatial, spectral, temporal, angular, polarization, etc.
NIR, high reflectance 0.5 very high leaf area 0.4 very low leaf area 0.3 sunlit soil reflectance(%) 0.2 Visible green, higher than red 0.1 Visible red, low reflectance 0.0 400 600 800 1000 1200 Wavelength, nm Spectral information: vegetation
Red band on red Green band on green Blue band on blue Colour Composites: spectral ‘Real Colour’ composite Approximates “real” colour (RGB colour composite) Landsat TM image of Swanley, 1988
Rondonia 1975 Rondonia 1986 Rondonia 1992 Temporal information Change detection http://earth.jsc.nasa.gov/lores.cgi?PHOTO=STS046-078-026 http://www.yale.edu/ceo/DataArchive/brazil.html
Always bear in mind..... when we view an RS image, we see a 'picture’ BUT need to be aware of the 'image formation process' to: • understand and use the information content of the image and factors operating on it • spatially reference the data
Remote Sensing:What is it and why do we use it? • Many monitoring issues global or regional • Drawbacksof in situ measurement ….. • Remote sensing can provide (not always!) • Global coverage • Range of spatial resolutions • Temporal coverage (repeat viewing) • Spectral information (wavelength) • Angular information (different view angles)
Why do we study/use remote sensing? • source of spatial and temporal information (land surface, oceans, atmosphere, ice) • monitor and develop understanding of environment (measurement and modelling) • information can be accurate, timely, consistent • remote access • some historical data (1960s/70s+) • move to quantitative RS e.g. data for climate • some commercial applications (growing?) e.g. weather • typically (geo)'physical' information but information widely used (surrogate - tsetse fly mapping) • derive data (raster) for input to GIS (land cover, temperature etc.)
Caveats! • Remote sensing has many problems • Can be expensive • Technically difficult • NOT direct • measure surrogate variables • e.g. reflectance (%), brightness temperature (Wm-2oK), backscatter (dB) • RELATE to other, more direct properties.