Download
1 / 33
330 likes | 355 Vues
Exploring the complex relationship between carbon cycles on land and water, highlighting the influence of human activities on atmospheric CO2 levels. Learn about key measurements, the role of oceans, and the impact of industrialization on global carbon budgets.

E N D
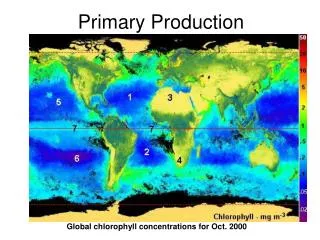
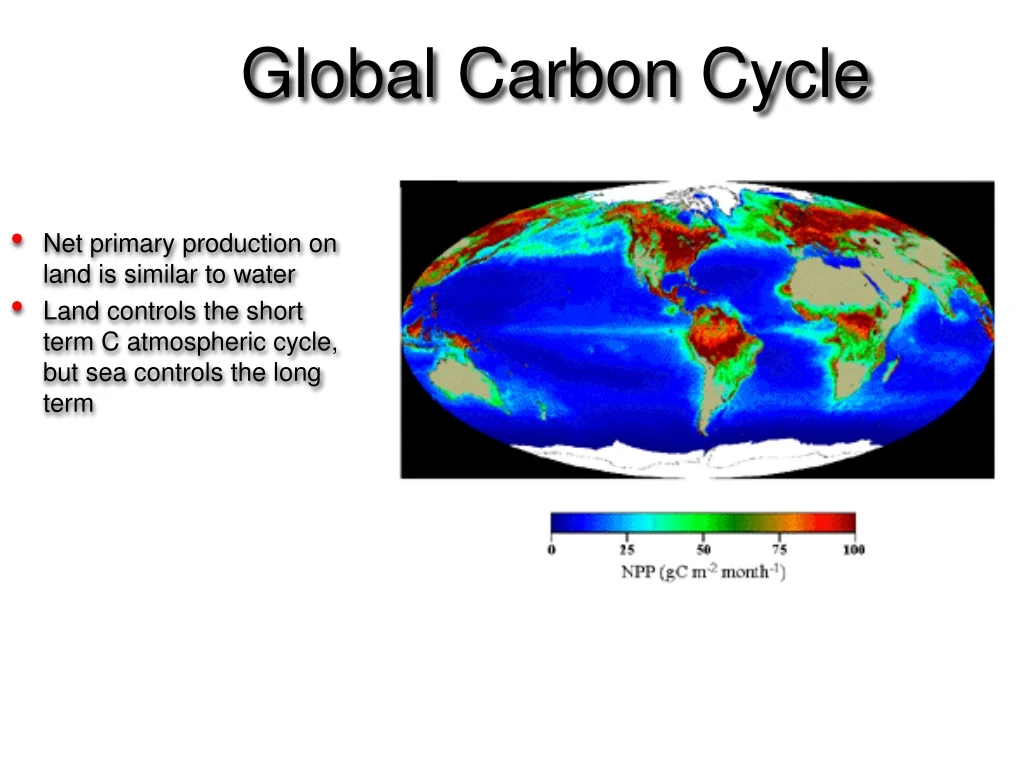
Global Carbon Cycle Net primary production on land is similar to water Land controls the short term C atmospheric cycle, but sea controls the long term
Units • 1 Pg = 1 Petagram = 1x10¹⁵g = 1 Billion metric tonnes = 1 Gigatonne • 1 Tg = 1 Teragram = 1x10¹²g = 1 Million metric tonnes • 1 Kg Carbon (C) = 3.67 Kg Carbon Dioxide (CO2)
Geologic C cycle • C moves from land to sea due to weathering and transport • C in sea can precipitate as CaCO3 and then later return to atmosphere after subduction and subsequent volcanism
CO2 is an important greenhouse gas • Accounts for a significant portion of the greenhouse forcing • Other gases include nitrous oxide (N2O), methane (CH4), chlorofluorocarbons, water vapor
Along comes Man • Over the last 150 years, CO2 concentrations have reached unprecedented levels due to industrialization
Fast and slow processes • Some exchanges in the C cycle are rapid and affect short-term changes in concentration of CO2 • Others are on geologic scales, yet Man has greatly accelerated these, especially fossil fuels
Anthropogenic Global Carbon Dioxide Budget Global Carbon Project 2010
Atmospheric C budget Atmospheric increase Net emissions from change in land use Emissions from fossil fuels Oceanic Uptake Missing Carbon = + - - 3.3 (±0.2) 5.5 (±0.5) 1.6 (±0.7) 2.0 (±0.8) 1.8 (±1.2)
390 388 386 Parts Per Million (ppm) 384 382 380 378 • 1970 – 1979: 1.3 ppm y-1 1980 – 1989: 1.6 ppm y1 • 1990 – 1999: 1.5 ppm y-1 2000 - 2009: 1.9 ppm y-1 2006 2009 2008 2011 2007 2010 Atmospheric CO2 Concentration GLOBAL MONTHLY MEAN CO2 December 2009: 387.2 ppm September 2010 (preliminary): 389.2 ppm 39% above pre-industrial Annual MeanGrowth Rate (ppm y-1) November 2010 2009 1.62 2008 1.80 2007 2.14 2006 1.84 2005 2.39 2004 1.60 2003 2.19 2002 2.40 2001 1.89 2000 1.22 Data Source: Pieter Tans and Thomas Conway, 2010, NOAA/ESRL
Plant growth affects CO2 seasonally Carbon tracker
Global Respiration and Photosynthesis Are (Were) in Balance Along Comes Man to Mess things Up
Atmospheric C budget (Again) Atmospheric increase Net emissions from change in land use Emissions from fossil fuels Oceanic Uptake Missing Carbon = + - - 3.3 (±0.2) 5.5 (±0.5) 1.6 (±0.7) 2.0 (±0.8) 1.8 (±1.2)
2000-2009 (PgC) 10 5 Source deforestation CO2 flux(PgC y-1) 1.1±0.7 5 Sink 10 1950 2000 1900 1850 Time (y) Human Perturbation of the Global Carbon Budget Global Carbon Project 2010; Updated from Le Quéré et al. 2009, Nature Geoscience; Canadell et al. 2007, PNAS
2000-2009 (PgC) 10 fossil fuel emissions 7.7±0.5 5 Source deforestation CO2 flux(PgC y-1) 1.1±0.7 5 Sink 10 1950 2000 1900 1850 Time (y) Human Perturbation of the Global Carbon Budget Global Carbon Project 2010; Updated from Le Quéré et al. 2009, Nature Geoscience; Canadell et al. 2007, PNAS
2000-2009 (PgC) 10 fossil fuel emissions 7.7±0.5 5 Source deforestation CO2 flux(PgC y-1) 1.1±0.7 5 Sink 10 1950 2000 1900 1850 Human Perturbation of the Global Carbon Budget Time (y) Global Carbon Project 2010; Updated from Le Quéré et al. 2009, Nature Geoscience; Canadell et al. 2007, PNAS
2000-2009 (PgC) 10 fossil fuel emissions 7.7±0.5 5 Source deforestation CO2 flux(PgC y-1) 1.1±0.7 atmospheric CO2 4.1±0.1 5 Sink 10 1950 2000 1900 1850 Time (y) Human Perturbation of the Global Carbon Budget Global Carbon Project 2010; Updated from Le Quéré et al. 2009, Nature Geoscience; Canadell et al. 2007, PNAS
2000-2009 (PgC) 10 fossil fuel emissions 7.7±0.5 5 Source deforestation CO2 flux(PgC y-1) 1.1±0.7 atmospheric CO2 4.1±0.1 5 Sink ocean 2.3±0.4 ocean (5 models) 10 1950 2000 1900 1850 Time (y) Human Perturbation of the Global Carbon Budget Global Carbon Project 2010; Updated from Le Quéré et al. 2009, Nature Geoscience; Canadell et al. 2007, PNAS
2000-2009 (PgC) 10 fossil fuel emissions 7.7±0.5 5 Source deforestation CO2 flux(PgC y-1) 1.1±0.7 atmospheric CO2 4.1±0.1 land 5 2.4 (Residual) Sink ocean 2.3±0.4 (5 models) 10 1950 2000 1900 1850 Time (y) Human Perturbation of the Global Carbon Budget Global Carbon Project 2010; Updated from Le Quéré et al. 2009, Nature Geoscience; Canadell et al. 2007, PNAS
1.1±0.7 PgC y-1 4.1±0.1 PgC y-1 47% 2.4 PgC y-1 27% Calculated as the residual of all other flux components + 7.7±0.5 PgC y-1 26% 2.3±0.4 PgC y-1 Average of 5 models Fate of Anthropogenic CO2 Emissions (2000-2009) Global Carbon Project 2010; Updated from Le Quéré et al. 2009, Nature Geoscience; Canadell et al. 2007, PNAS
Sinks for CO2 • Ocean is the primary sink that controls CO2 over the long term • CO2 is more soluble in cold saline waters and enters the deep reservoir where this water sinks (N. Atlantic and off Antarctica) (solubility pump) • As Earth warms, ocean will be more stratified, which will slow this sinking and slow oceanic uptake of CO2 • The CO2 buffering capacity will also weaken over time since cations from weathering are required to balance system • Plankton remove CO2, which aids the absorption of CO2 from the atmosphere and sinking takes some of this away (CaCO3 shells help too) (biological pump) • None of these are enough and CO2 continues to increase in the atmosphere • Increase the “biological pump” by fertilization or having a change in the C:N:P ratio of plankton could affect C cycle
Sinks for CO2 • Terrestrial biota also take up CO2, but there is no pump and CO2 returns to the atmosphere from respiration (50% by plants and 50% by microbes) • Since primary production is not saturated with CO2, uptake will increase as CO2 increases. However, rubisco saturates at 800-1000 ppmv and increased uptake before that will decreases over time (microbes may increase respiration too) • We have to consider changes in the cycles of other elements as well since these affect production and decomposition
A Lot of CO2 Can Dissolve in Seawater However, only surface water is in contact with the atmosphere and deep mixing is slow
Methane sources • Methane is produced by anaerobic bacteria in wetlands (including rice paddies), the rumen, termite guts, and landfills. • It is also released during gas and coal production Atmospheric methane concentrations
Methane hydrates • Crystalline solid consisting of gas molecules, usually methane, surrounded by a cage of water molecules. It looks like ice. Stable in ocean floor greater than 300 m, and can be in a layer several hundred meters thick. • More abundant than all fossil fuels combined