Correlational Designs
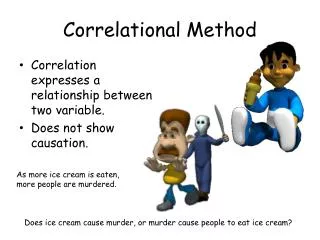
Correlational Designs. Researchers often want to go beyond simply describing their observations. Correlation allows for prediction Good when impractical or unethical to do an experiment The effect of head injury on behavior.

Correlational Designs
E N D
Presentation Transcript
Correlational Designs • Researchers often want to go beyond simply describing their observations. • Correlation allows for prediction • Good when impractical or unethical to do an experiment • The effect of head injury on behavior.
Relationships between pairs of scores from each subject are known as simple correlations. • The Pearson product-moment correlation coefficient (r) • The Pearson r can result in three situations • positive correlation • negative correlation • no correlation
The values of a correlation coefficient can vary from –1 to +1. • The – or + tells us whether the variables are negatively or positively correlated • the numerical value of r tells us the strength of the association.
Time spent studying and grades. • devise operational definitions • Time spent studying • grades • Notice both variables are measured neither of the variables are manipulated X axis = GPA Y axis = Time spent studying (hours/week)
Time spent drinking and grades • Operational definitions • X axis = GPA • Y axis = Time spent drinking (hours/week)
The main draw back of correlational studies • correlation does not imply causation. • Let’s say there is a correlation between exercise and anxiety • Do you think this would be positive or negative? • Even if we had a perfect correlation of -1 between exercise and anxiety • Does not mean exercise causes lower anxiety
Two main issues • Direction of causality • people who exercise a lot, blow off steam, and thus have lower anxiety • people with low anxiety take more time to exercise • Third variable problem • Health • Healthier people tend to have less anxiety and also tend to exercise a lot. • Unhealthy people tend to have greater anxieties and also don’t exercise much. • Is drinking red wine in moderation good for your health?
Multiple correlation • Sometimes we wish to see whether there is a relationship among a number of measured behaviors. • Inter correlations among three or more behaviors can be computed with a statistic known as multiple correlation. • represented as R. • R is conceptually similar to r and can be used to add to information gained from simple correlations.
Causal Modeling • Causal Modeling • As we now know, correlational studies cannot show causality • Experiments can • However in some cases it may be unfeasible to run an experiment. • Because of this researchers have sought alternate methods of reducing the ambiguity of correlational findings. • We discuss one causal modeling technique
Cross-Lagged Panel Design • T.V. watching and size of vocabulary at ages 3 and 8. • There was an initial correlation that implied that these two variables were weakly positively correlated. • So, does watching T.V. increase your vocabulary, or does having a better vocabulary increase T.V. watching?
Quasi-Experimental Designs • used when subjects cannot be randomly assigned to receive different treatments • We will discuss four types • Ex post facto designs • Longitudinal designs • Cross sectional designs • Pretest postest designs
Quasi Experimental Designs • Ex Post Facto Studies = After the fact • In ex post facto studies the researcher relies on changes that occurred before the study to make up the groups. • Gender • Males – spatial • Females - verbal
Cohen, Glass, and Singer (1973) • Effect of environmental noise on reading ability, and auditory discrimination in children. • large apartment building in New York City. • built over a highway • Low floors noisy • Higher floors quiet • found that children from the lower floors had poorer reading skills, and performed worse on auditory discriminations. • First this is a very nice study. • But in the interest of showing that ex post facto studies, do have threats to internal validity • can you think of any other reasons for these differences?
ex post-facto design of vehicle safety • looked at the number of deaths related to different types of cars. • safe • volvo 240, 740 • Plymoth voyager • Mercedes • Unsafe • Corvette • small trucks • Ford Escort. • The headline of the report asks “Which Vehicles are the Safest?” • Safety a legitimate conclusion?
Pros and cons of ex-post facto designs • low in internal validity • there is always a chance that some other difference between groups was the cause of the effect • Better external validity • allow us to understand complex behaviors that occur in real life • realistic data that can be applied in practical ways
LONGITUDINAL DESIGNS • The cross-lag panel examined how variables are related over time • longitudinal designs are interested in how time effects data • In a longitudinal design the same subjects are studied across time to see if there behavior changes in a systematic way. • This is particular important for psychologists studying human growth and development
Lewis Terman • Terman study • 1,528 California children who were considered to be highly intelligent. • IQ’s at least 135. • studied these children throughout childhood, adolescence and into adulthood (1925, 1947, 1959). • provided a rich description of the lives of highly intelligent individuals. • It disconfirmed many negative stereotypes of high intelligence. • well adjusted both socially and emotionally. • The data have now been archived and have been used by other researchers. • study social and health practice factors associated with age of death.
There are some problems with Longitudinal designs. • very time consuming • retention of subjects
Cross-Sectional Designs. • approximates results from a longitudinal study. • subjects of different ages are compared at a single point in time. • Suppose you are interested in examining how the ability to learn a computer application changes as people grow older. • Using the cross sectional design you might study people that are • 20, 30, 40, 50, 60, and 70 years old. • give the participants the same computer learning task, and you could compare the groups on their performance.
Pros and cons of cross sectional • The cross sectional design is much more common than a longitudinal design because it is less expensive and immediately yields useful results • There are some disadvantages to the cross-sectional design however. • Cohort effects • a group of individuals born at about the same time, exposed to the same events in society, and influenced by the same demographic trends. • These differences in cohorts can represent different cultural climates, educational systems, and child rearing practices.
The single group pretest-posttest design. • This is an often used technique that measures the level of some variable before and after some event. • Governor of Connecticut (1955) • crack down on speeding • stiffer penalties • 1st offense 30 day suspension of drivers license • 2nd offense = 60 days • 3rd offense = indefinite suspension • It was opposed by many but went through • fatalities decreased to from 324 to284 in 1956, • The Governor was quoted as saying with the saving of 40 lives we can say that the program was definitely worth while.
Do you think that the program actually decreased deaths? • What if we looked across time to see the pattern of ups and downs • called an Interrupted time -series design