Correlational Method
Correlational Method. Correlation expresses a relationship between two variable. Does not show causation. As more ice cream is eaten, more people are murdered. Does ice cream cause murder, or murder cause people to eat ice cream?. Types of Correlation. Positive Correlation

Correlational Method
E N D
Presentation Transcript
Correlational Method • Correlation expresses a relationship between two variable. • Does not show causation. As more ice cream is eaten, more people are murdered. Does ice cream cause murder, or murder cause people to eat ice cream?
Types of Correlation Positive Correlation • The variables go in the SAME direction. Negative Correlation • The variables go in opposite directions. Studying and grades hopefully has a positive correlation. Heroin use and grades probably has a negative correlation.
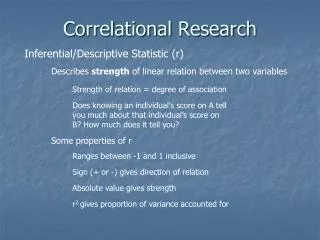
Correlation Coefficient • A number that measures the strength of a relationship. • Range is from -1 to +1 • The relationship gets weaker the closer you get to zero. Which is a stronger correlation? • -.13 or +.38 • -.72 or +.59 • -.91 or +.04
Statistics • Recording the results from our studies. • Must use a common language so we all know what we are talking about.
Descriptive Statistics • Just describes sets of data. • You might create a frequency distribution.
Central Tendency Let’s look at the salaries of the employees at Dunder Mifflen Paper in Scranton: • Mean, Median and Mode. • Watch out for extreme scores or outliers. $25,000-Pam $25,000- Kevin $25,000- Angela $100,000- Andy $100,000- Dwight $200,000- Jim $300,000- Michael The median salary looks good at $100,000. The mean salary also looks good at about $110,000. But the mode salary is only $25,000. Maybe not the best place to work. Then again living in Scranton is kind of cheap.
Normal Distribution • In a normal distribution, the mean, median and mode are all the same.
Distributions • Outliers skew distributions. • If group has one high score, the curve has a positive skew (contains more low scores) • If a group has a low outlier, the curve has a negative skew (contains more high scores)
Other measures of variability • Range: distance from highest to lowest scores. • Standard Deviation: the variance of scores around the mean. • The higher the variance or SD, the more spread out the distribution is. Shaq and Kobe may both score 30 ppg (same mean). But their SDs are very different.
Inferential Statistics • The purpose is to discover whether the finding can be applied to the larger population from which the sample was collected. • P-value= .05 for statistical significance. • 5% likely the results are due to chance.
APA Ethical Guidelines for Research • IRB- Internal Review Board • Both for humans and animals.
Animal Research • Clear purpose • Treated in a humane way • Acquire animals legally • Least amount of suffering possible.
Human Research • No Coercion- must be voluntary • Informed consent • Anonymity • No significant risk • Must debrief