Correlational Problems and Fallacies
This module explores essential concepts surrounding correlation coefficients and their interpretation. We discuss the distinction between correlation and causation, the implications of perfect correlation, and the nuances of stating "no correlation" versus "no relation." Additionally, we address the issues arising from combining different populations and the effects of restricting data ranges. Examples such as Anscombe’s Quartet illustrate how scatterplots can provide deeper insights into correlations. This knowledge is vital for accurately interpreting statistical results in research.

Correlational Problems and Fallacies
E N D
Presentation Transcript
Correlational Problems and Fallacies James H. Steiger
Introduction • In this module, we discuss some common problems and fallacies regarding correlation coefficients and their interpretation • Interpreting a correlation • Correlation and causality • Perfect correlation and equivalence • No Correlation vs. No Relation • Combining Populations, and Ignoring Explanatory Variables • Restriction of Range
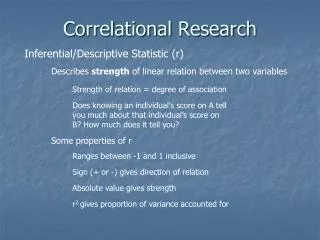
Interpreting a Correlation • If scores are on roughly similar scales, the shape of the scatterplot can reveal a substantial amount about the correlation.
Anscombe’s Quartet Each of the above 4 data sets has the following summary statistics: Each has a best fitting linear regression line of
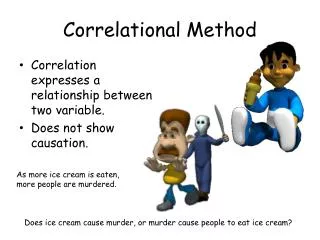
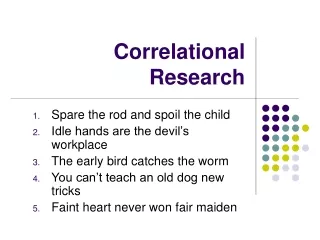
Correlation and Causality • Correlation is not causality. This is a standard adage in textbooks on statistics and experimental design, but it is still forgotten on occasion. • Example: The correlation between number of fire trucks sent to a fire and the dollar damage done by the fire.
Perfect Corrrelation and Equivalence • Two variables may correlate highly (or even perfectly), without measuring the same construct. • Example: Height and weight on the planet Zorg.
Zero Correlation vs. No Relation • The Pearson correlation coefficient is a measure of linear relation. Many strong relationships are nonlinear. Always examine the scatterplot!
Combining Populations If two groups with different means and/or covariances are combined, the resulting mixture can exhibit spurious correlations. Example. (C.P.) Suppose the correlation between strength and mathematics performance is zero for 6th grade boys, and zero for 8th grade boys. Does this mean it will be zero in a combined group of 6th and 8th graders?
Restriction of Range • Often, when linear regression is used to predict performance, the population is restricted. (For example, the GRE is used to predict performance in graduate school, but people with low GRE scores are often refused admission to graduate school. Consequently, the “available data” are a truncated version of the full data set.
The “Third Variable Fallacy” • Often people assume, sometimes almost subconsciously, that when two variables correlate highly with a third variable, they correlate highly with each other. • Actually, if rXW and rYWare both .7071, rXY can vary anywhere from 0 to 1. • Only when rXW and/or rYWbecome very high does the correlation between X and Y become highly restricted.