Download
1 / 1
10 likes | 249 Vues
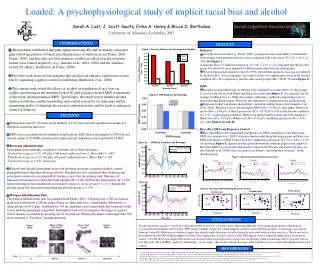
ERNs by Condition and Beverage. Figure 4a. -10.0. Alcohol. Placebo. White Tool. FCz. Black Tool. -7.5. -5.0. -2.5. Amplitude (µV). Black Tool – Black Gun. Black Tool – Black Gun. Black Tool – Black Gun. -5.0. 0.0. -5.0. -5.0. White Tool – White Gun. White Tool – White Gun.

E N D
ERNs by Condition and Beverage Figure 4a. -10.0 Alcohol Placebo White Tool FCz Black Tool -7.5 -5.0 -2.5 Amplitude (µV) Black Tool – Black Gun Black Tool – Black Gun Black Tool – Black Gun -5.0 0.0 -5.0 -5.0 White Tool – White Gun White Tool – White Gun White Tool – White Gun -4.0 -4.0 -4.0 FCz FCz FCz -3.0 -3.0 -3.0 2.5 -2.0 -2.0 -2.0 -1.0 -1.0 -1.0 Amplitude (µV) Amplitude (µV) Amplitude (µV) 5.0 0.0 0.0 0.0 1.0 1.0 1.0 2.0 2.0 2.0 -300 -200 -100 0 100 200 300 400 500 600 -400 3.0 3.0 3.0 4.0 4.0 4.0 -1200 -950 -700 -450 -200 50 300 550 800 1050 -1200 -950 -700 -450 -200 50 300 550 800 1050 -1200 -950 -700 -450 -200 50 300 550 800 1050 Time (ms) Time (ms) Time (ms) Control group 2 1 Race bias ERN 0 r = -.45* -1 r = -.45* -2 -3 0.4 0.5 0.6 0.7 0.8 0.9 1 PD Control Loaded: A psychophysiological study of implicit racial bias and alcohol Sarah A. Lust, J. Scott Saults, Erika A. Henry & Bruce D. Bartholow University of Missouri, Columbia, MO INTRODUCTION RESULTS • Research has established that participants more quickly and accurately categorize guns following pictures of black men than pictures of white men (see Payne, 2001; Payne, 2005), and that this race bias produces conflict as reflected in the response-locked error-related negativity (e.g., Amodio et al., 2004; 2008) and the stimulus-locked N2 (Henry, Bartholow, & Payne, 2006). • Previous work from our lab indicates that alcohol can enhance expressions of race bias by impairing cognitive control of inhibition (Bartholow et al., 2006). • The current study tested the effects of alcohol on regulation of race bias via conflict monitoring in the stimulus-locked N2 and response-locked ERN components of the event-related potential (ERP). Specifically, this study tested whether alcohol interferes with the conflict monitoring and control system by (a) reducing conflict monitoring and/or (b) limiting the extent to which detected conflict leads to enhanced control of behavior. • Behavior • As in previous research (e.g., Payne, 2001), participants were more likely to misidentify tools as guns when primed with black faces compared with white faces, F(1, 61) = 14.9, p< .001 (see Figure 1). • A marginal Race x Condition interaction, F(2, 64) = 2.14, p =.13, indicated that the Alcohol group was relatively more impaired by Black primes than were the other groups. • Process Dissociation Analyses (Jacoby, 1991) showed that automatic bias was not affected by alcohol (Ms = .59 in all groups), but control of bias was significantly worse in the alcohol condition (M =.58) compared to placebo and control groups (Ms = .80 & .76) (see Figure 2). • ERPs • Stimulus-locked subtraction waveforms were calculated to isolate effects of object (gun vs. tool) on the N2 for both White and Black face trials (see Figure 3). As expected, the N2 is larger for Black face vs. White face primes, reflecting conflict in categorizing tools vs. guns following Black primes. However, this difference is attenuated in the alcohol group. • Response-locked waveforms showed that, consistent with previous work (Amodio et al., 2004, 2008), Black-tool errors elicited larger ERNs (M = -13.68 μV) than either White-tool errors (M = -11.69 μV) or Black-gun errors (M = -10.70 μV) for Ps in the placebo condition (ps < .05). In the alcohol condition, ERNs were much smaller overall and were similar for Black-tool (M = -5.47 μV), White-tool (M = -5.32 μV), and Black-gun errors (M = -4.50 μV). (see Figures 4a and 4b) • Race Bias ERN and Response Control • Race bias ERNs were calculated as the Black-tool ERN controlling for the Black-gun ERN (see Amodio et al., 2008). A general linear model using Beverage group and Race bias ERN as predictors of PDP Control showed a significant interaction, F(2, 54) = 4.65, p < .05. As shown in Figure 5, separate residual plots showed that, whereas larger (more negative) Race bias ERN was associated with greater control in the Placebo and Control groups (see also Amodio et al., 2008), this association was absent – and somewhat reversed – in the Alcohol group. Figure 1. Accuracy Difference by Beverage and Condition 0.1 Black 0.09 White 0.08 0.07 0.06 Accuracy Difference Score (Gun – Tool) 0.05 0.04 0.03 0.02 0.01 0 Alcohol Control Placebo Beverage Group Figure 2. PDP Analyses by Beverage METHOD • Participants were 67 (34 men) social drinkers, 21-35 years old, who qualified according to a telephone screening interview. • ERPs were recorded from 64 standard scalp locations. EEG data were sampled at 1000 Hz and filtered online at .05-40Hz (referenced to right mastoid). Impedance was kept below 10 KΩ. • Beverage administration • Participants were randomly assigned to consume one of three beverages: • Alcohol beverage (n = 23):.80 g/kg (100-proof vodka and tonic); Mean BAC = .09% • Placebo beverage (n = 22):.04 g/kg (10-proof vodka and tonic); Mean BAC = .0% • Control beverage (n = 22): plain tonic • Placebo and Alcohol participants were told that their beverage contained alcohol; control participants knew that their beverage did not. Breathalyzer tests confirmed that alcohol group participants achieved a maximum BAC during or just after the priming task. Measures of subjective intoxication revealed that both Alcohol (M = 3.62) and Placebo participants (M = 2.26) reported feeling at least moderately intoxicated (where 1= not at all and 5 = very); though the alcohol group felt more intoxicated than the placebo group, p < .001. • Weapon Identification Task • The weapon identification task was adapted from Payne (2001). On each trial, a 500 ms fixation mask was followed by a 200 ms prime (black or white male face), immediately followed by a target picture (tool or gun), displayed for 100 ms, and then a post-target mask that remained on the screen until the participant responded. Participants’ task was to categorize the target as a gun or tool as quickly as possible by pressing one of two buttons. When participants took longer than 500 ms to respond, a “Too Slow” prompt appeared. Figure 3. Stimulus-locked subtraction waveforms Alcohol Placebo Control R Figure 4b. -10.0 Alcohol Placebo FCz Black Gun Figure 5. Race bias ERN Predicting Response Control -7.5 Black Tool Alcohol group Placebo group -5.0 2 1.6 1 r = .44 1.2 -2.5 Amplitude (µV) 0 0.8 Race bias ERN 0.0 Race bias ERN -1 0.4 r = -.57** -2 0 2.5 -0.4 -3 -0.8 5.0 -4 0.2 R 0.3 0.4 0.5 0.6 0.7 0.8 0.9 1 0.3 0.4 0.5 0.6 0.7 0.8 0.9 PD Control PD Control 100 -400 -200 -100 200 -300 0 300 400 500 600 CONCLUSIONS Time (ms) Alcohol decreased accuracy overall, but especially on Black-tool (i.e., race bias) trials, indicating difficulty overcoming the prepotent, stereotypical association between Blacks and violence. PDP analyses further suggest that alcohol impairs response control but has no effect on automatic associations. Stimulus-locked N2 difference waveforms suggest that alcohol limits detection of conflict typically associated with race-bias trials (e.g., Black-tool trials); the response-locked ERNs further support this idea. Most importantly, alcohol’s effects on the ERN appear to have important implications for response control. Overall, these data suggest that alcohol can increase behavioral expressions of race bias via limiting conflict monitoring effects typically seen on race bias trials (N2 and ERN), and/or by eliminating – or reversing – the extent to which race-bias conflict detection is associated with enhanced behavioral control. REFERENCES Amodio, D.M., Devine, P.G, Harmon-Jones E.J. (2008). Individual differences in the regulation of intergroup bias: the role of conflict monitoring and neural signals for control.Personality and Social Psychology, 94, 60-74. Amodio, D.M., Harmon-Jones, E., Devine, P.G., Curtin, J.J., Hartley, S.L., & Covert, A.E. (2004). Neural signals for the detection of unintentional race bias. Psychological Science, 15, 88-93. Bartholow, B.D., Dickter, C.L., & Sestir, M.A. (2006). Stereotype activation and control of race bias: Cognitive control of inhibition and its impairment by alcohol. Journal of Personality and Social Psychology, 90, 272-287. Payne, B.K. (2005). Conceptualizing control in social cognition: How executive control modulates the expression of automatic stereotyping. Journal of Personality and Social Psychology, 89, 488-503. Payne, B.K. (2001). Prejudice and perception: The role of automatic and controlled processes in misperceiving a weapon. Journal of Personality and Social Psychology, 81, 181-192.