Impact of Selection Bias
Impact of Selection Bias. Selection bias occurs when selection into or out of the study is related to exposure status. Examples: in a cohort study , the exposed may be lost to follow-up at a higher rate than the unexposed

Impact of Selection Bias
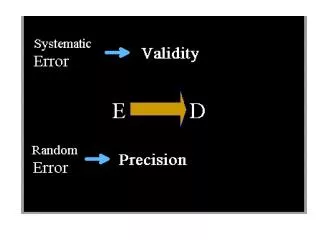
E N D
Presentation Transcript
Impact of Selection Bias • Selection bias occurs when selection into or out of the study is related to exposure status. • Examples: • in a cohort study, the exposed may be lost to follow-up at a higher rate than the unexposed • In a case-control study, exposed controls may more likely be selected into the study than unexposed controls • In a cross-sectional study, exposed and unexposed workers may differ in their rate (or length) of survival for a particular disease. • The bias can be towards or away from the null, i.e., the exposure effect may be underestimated or overestimated
Selection Bias:Biased selection of cases • Selection of cancer cases based on death certificate diagnoses versus • Selection of cancer cases identified by a population-based cancer registry with histological confirmation of diagnoses
Selection bias in case-control studies • bias in the selection of cases • the exposure prevalence among cases in the study population differs from the exposure prevalence among cases in the source population • bias in the selection of controls • the exposure prevalence among controls in the study population differs from the exposure prevalence among controls in the source population
Selection Bias:Biased selection of cases • A study identified lung and pleura/peritoneal cancer cases from a population-based cancer registry from 1973-1981. • Cases had to be deceased during 1979-1981. • Diagnoses were histologically confirmed.
Selection Bias:Biased selection of cases • Death certificates were obtained for the cases and diagnoses on the death certificate were compared to the histologically confirmed diagnoses. • Information on usual industry of employment was compared between cases selected from the registry based on histological confirmation of diagnoses and cases selected based on diagnoses on the death certificate
Table 1 Percent agreement between deceased histologically confirmed lung and pleura/peritoneal cancer cases identified by a population-based cancer registry and the diagnoses on their death certificates.
Table 1 • Note the high agreement with lung cancer: 93.4% of the histologically confirmed lung cancer cases have death certificates with a similar diagnosis. • Note the poor agreement with pleura/peritoneal cancers: only 28.6% of the histologically confirmed pleura/peritoneal cancer cases have death certificates with a similar diagnosis.
Selection Bias:biased selection of cases Comparison of usual industry of employment between registry cases and death certificate cases
Table 2 • Lung cancer
Table 2 • Lung cancer
Table 2 • 2. Pleura/Peritoneal Cancer
Table 2 • 2. Pleura/Peritoneal Cancer
Selection Bias:biased selection of cases • No differences occurred in usual industry of employment between lung cancer cases selected from a cancer registry and lung cancer cases selected from death certificates. • No selection bias because of the close agreement between registry diagnoses and death certificate diagnoses for lung cancer
Selection Bias:biased selection of cases • Large differences occurred in usual industry of employment between pleura/peritoneal cancer cases selected from a cancer registry and pleura/peritoneal cancer cases selected from death certificates. • Selection bias occurred because of: • the lack of agreement between registry diagnoses and death certificate diagnoses for pleura/peritoneal cancers, and • possible association between pleura/peritoneal cancer diagnosis on death certificate and over classifying usual industry as construction or unemployed/retired (and underclassifying automobile industry)
Selection Bias: biased selection of controls • Recall that the role of a control series in a case-control study is to be representative of the distribution of the exposure(s) of interest in the source population that gave rise to the cases. • In other words, the selection of controls must be independent of the exposure(s) of interest in the source population
Selection Bias:biased selection of controls Types of control series: • controls sampled from the source population • controls sampled from disease groups • patients at hospitals serving the source population • controls sampled from a population-based disease registry or from death certificates
Selection Bias:biased selection of controls Options for control selection from disease groups Sampling controls from: • all other diseases • all other diseases except those known to be associated with the exposure of interest • a disease known not to be associated with the exposure of interest
Selection Bias:biased selection of controls Advantages and disadvantages of using population controls versus diseased controls
General Population controls: represents the exposure prevalence in the source population possible recall bias if cases are more likely to recall exposures than controls “Other disease controls”: may not represent exposure prevalence in source population because one or more of the diseases may be associated with exposure recall bias less likely because cases and controls have similar motivation for recall Selection Bias: biased selection of controls
General Population controls: non-response and lower participation rate is possible since motivation to participate is less feasible if source population can be enumerated and sampled in a systematic (random) fashion “Other disease controls”: participation rate should be high since there is motivation to participate useful when the source population is difficult to enumerate (e.g., catchment area of a hospital) or difficult to sample in a systematic (random) fashion Selection Bias: biased selection of controls
Occupations observed among “other cancer controls” and expected based on census data (New Zealand study)
Occupations observed among “other cancer controls” and expected based on census data (New Zealand study) Based on the (“expected”) occupational distribution from the New Zealand census, the control series (cancers other than the cancers of interest) in this study: • overestimated the percentage of professional/ technical and administrative/managerial occupations in the source population • underestimated the percentage of clerical and sales/service occupations in the source population
New Zealand case-control study of non-Hodgkins lymphoma (NHL) and exposure to phenoxyherbicides Two control series used: • general population controls • cancers other than NHL (“other cancers”)
Comparisons of the odds ratios for NHL and exposure to phenoxyherbicides for the two control groups
Comparisons of the odds ratios for NHL and exposure to phenoxyherbicides for the two control groups • Differences in the odds ratios obtained using “other cancer” controls and odds ratios obtained using population controls were slight. • Bias is slight because the cancers in the control group are not strongly associated with the exposure of interest
Case-control study of birth defects and maternal diabetes using two control groups: • “normal” (without birth defects) controls • controls selected from other birth defects (“other defects”)
Comparison of odds ratios for birth defects and maternal diabetes for the two control groups
Case-control study of birth defects and maternal diabetes using two control groups • Considerable differences in odds ratios were obtained • Using “other defects” controls may have biased results towards the null • Bias towards the null could occur because maternal diabetes was associated with several of the defects included in the “other defects” control group
What control series is appropriate to avoid selection bias? • If source population can be precisely defined, then controls sampled from the source population is the desirable option • the effect of recall bias tends to be small and often would be less than the selection bias introduced by using “other disease” controls • using “other disease” controls may cause more bias than it prevents because the selection bias and the ever-present exposure misclassification can together produce considerable bias results towards the null
What control series is appropriate to avoid selection bias? • Although the possibility of recall bias should be considered, the use of “other disease” controls is not routinely needed and should only be used with caution and when it is not feasible to use population controls
What control series is appropriate to avoid selection bias? When using “other disease controls”: • Include only diseases for which there is some evidence indicating that they are not associated with the exposure(s) of interest • Include a variety of diseases to dilute and selection bias • Exclude any disease with a relatively strong association with the exposure(s) of interest • Do not use only one disease as the control unless you are certain that it is unrelated to the exposure(s) of interest
What control series is appropriate to avoid selection bias? • There is little advantage to using multiple control groups, e.g., a population control group and a “other disease” control group • costly to have two groups • if the results differ considerably, then it is unclear which control group is less biased • if the results are similar, it may be uncertain whether both are accurate or both are biased • more appropriate to identify the best control group than to have two groups
Retrospective Cohort Study of Municipal Workers in Buffalo NY • Full-time municipal workers employed ≥5 yrs • Follow-up period: 1950 – 1979 starting after worker completed 5 years of employment • 10,128 males in the cohort • 7% of the cohort lost to follow-up (vital status unknown after termination of employment)
Retrospective Cohort Study of Municipal Workers in Buffalo NY Four Options for dealing with lost to follow-up: • Remove workers lost to follow-up from study • Assume worker is dead at end of follow-up • Both options lead to underestimates of expected numbers of deaths and overestimates of the SMR (Observed/Expected).
Retrospective Cohort Study of Municipal Workers in Buffalo NY Four Options for dealing with lost to follow-up: • Assume worker is alive at end of follow-up • SMR is underestimated because some deaths are missed, but expected numbers are maximized • Worker is lost at termination of employment • Worker contributes no person-time after termination of employment • Most defensible option
Retrospective Cohort Study of Municipal Workers in Buffalo NYSMRs (Observed/Expected)
Retrospective Cohort Study of Municipal Workers in Buffalo NYSMRs (Observed/Expected)All causes of death