Download
1 / 26
260 likes | 284 Vues
Aging, Health Systems and Health Outcomes: The World Cities Project Cadenza Symposium on Age-Friendly World Cities & Environment October 8-9, 2010 Victor G. Rodwin Professor of Health Policy and Management Wagner School, New York University. Growth of Urbanization Worldwide.

E N D
Aging, Health Systems and Health Outcomes: The World Cities ProjectCadenza Symposium on Age-Friendly World Cities & EnvironmentOctober 8-9, 2010Victor G. RodwinProfessor of Health Policy and ManagementWagner School, New York University
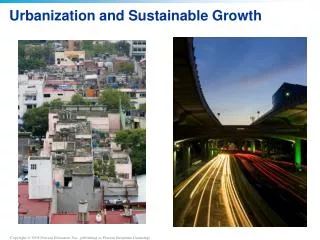
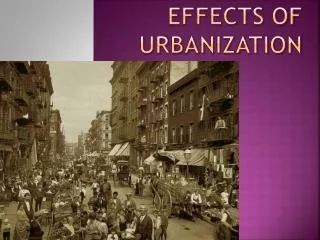
Growth of Urbanization Worldwide Virtually all population growth projected by UN between 2010 until 2030 will be concentrated in cities. In 2000, 47% of world’s population lived in cities; in 2030, 60% will live in cities.
Growth of Megacities • 2000 - 20 “Megacities” Over 10 Million People All in Developing World Except NYC and Tokyo In 2015, there will be 23 Megacities
New York City 8.0 million (2000); 65+ = 937,857 Paris and First Ring 6.2 million (1999) 65+ = 848,723 Bronx Seine-Saint Denis Manhattan Queens Hauts-de- Seine 1.5 Staten Island 4.0 2.1 Brooklyn 6.5 Val-de- Marne Greater London 7.3 million (2000) 65+ = 908,175 Central Tokyo 8.1 million (2000) 65+ =1,336, 289 Outer London Outer Tokyo Inner London Inner Tokyo 4.7 6.0 2.6 2.1
Health Care Resources: Manhattan, Inner London, Paris and Tokyo (1995-2000)
LE at 65: National and City Levels Source: Rodwin, Gusmano, Montero(2003) Etudes et Résultats, DRESS, Paris.
Men & Women 85+ Living Alone:Manhattan, Paris, Inner London, & Inner Tokyo
Nursing Home Care: Similarities • Nursing home rates are lower in the urban cores than in the first rings • High price of real estate in the urban cores tends to restrict investment in institutional long-term care facilities compared to first ring • In NYC and Paris, persons over 65 who live alone have higher levels of educational attainment than those who live in institutions
Home Help Users 65 Years and Over London, New York, Paris and Tokyo(2000-2002)
Globalization and policy convergence? • Evidence of convergence: significant and growing inequalities of income, housing, health and health care within all four cities. • Evidence that “politics matters”: Japan’s LTCI; France’s recent expansion of home care services • Evidence captured by neither: New York, the “hardest” global city provides twice as many nursing home beds and as much home help as the “soft” cities in our analysis
Challenges and Lessons • Can we afford to allow frail older persons to remain in the urban core of world cities? • Local policies fill the residuals left by higher levels of government • Local administrative discretion is significant • Cities cope with diverse older persons • Providing information to older persons and giving them greater voice • Supporting the oldest old living alone and identifying the most isolated and vulnerable
Health Outcomes and Health System Performance - Life expectancy at birth - Probability of survival given diseases - Premature Mortality - Avoidable Mortality - Access to Primary Care - Access to Specialty Care
Premature Mortality Rate per 1,000 by Neighborhood Quartile1999-2003 Age-Standardized, UN World Population 2004
Defining “Avoidable Mortality” • “Avoidable Mortality” premature death (prior to 75 years) from diseases amenable to screening and medical intervention • Examples include: • ischemic heart disease • several malignancies: breast, colon, cervix, skin • tuberculosis • Maternal deaths
Average rate, 1999-2003 From Chau, PH, Woo, J et. al. Avoidable Mortality Pattern..European J. Public Health
Comparing Access to Primary Care • Marker • Conditions • Examples: • Acute Myocardial • Infarction • Appendicitis • GI obstruction • Hip fracture • Avoidable Hospital Conditions • Examples: • Pneumonia • Congestive Heart Failure • Asthma • Cellulitus We use the list of ICD-9/ICD-10 Codes from the definition used by Dr. Joel Weissman and colleagues. The Weissman definition includes the following conditions: pneumonia, congestive heart failure, asthma, cellulitis, perforated or bleeding ulcer, pyelonephritis, diabetes with ketoacidosis or coma, ruptured appendix, malignant hypertension, hypokalemia, immunizable conditions, and gangrene.
Characteristics of Residents by Income Quartile of NeighborhoodSocioeconomic Status: Manhattan, Inner London, Paris 1. Bachelors degree or higher Sources: U.S. Census 2000; French Census 1999; National Office of Statistics, UK 2001
Avoidable Hospital Conditions per 1,000 by Neighborhood Quartile1999-2003 Age-Standardized, UN World Population 2004
Revascularizations per 100,000 (35+), by Neighborhood Quartile1999-2003 Age-Standardized, UN World Population 2004
Lower Joint Replacement Rate per 100,000 by Neighborhood Quartile1999-2003 Age-Standardized, UN World Population 2004