Computational Image Classification
Computational Image Classification. UMBC Department of Computer Science eBiquity Research Group February 19, 2010. Overview. Introductions Image Classification Initial Results Future Efforts. Introductions. Faculty Yelena Yesha, PhD Michael Grasso, MD, PhD John Dorband, PhD

Computational Image Classification
E N D
Presentation Transcript
Computational Image Classification UMBC Department of Computer Science eBiquity Research Group February 19, 2010
Overview • Introductions • Image Classification • Initial Results • Future Efforts
Introductions • Faculty • Yelena Yesha, PhD • Michael Grasso, MD, PhD • John Dorband, PhD • Tim Finin, PhD • Milt Halem, PhD • Anupam Joshi, PhD • Graduate students • RonilMokashi • Darshana Dalvi
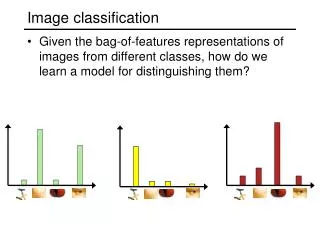
Computational Image Classification • Categorize a raster image into a finite set of classes. • Convert raster data into feature vectors. • Support vector machine image classifier. • Metadata to map specific classes to biological characteristics.
Image Classification Examples • Computer assisted diagnosis of prostate and breast cancer biopsies. • Segmentation of hysteroscopy video. • Echocardiogram analysis. • Skin cancer detection. Biomedical Imaging: from Nano to Macro, 2007;:1284-1287 IEEE TITB, 2008 May;12(3):366-376 Proceedings 27th IEEE EMBS, 2005;:5680-5683 Conf Proc IEEE Eng Med Biol Soc, 2006;1:4775-8
Related Efforts: Video Segmentation • Laparoscopic cholecystectomy videos. • 378 representative images from 5 videos. • Analyzed 49 separate image features.
Video Segments Frames Related Efforts: Video Segmentation • Image classification. • Distance metric to identify best features. • Support vector machine image classifier. • Accuracy of 91%.
Related Efforts: Video Segmentation • Future directions. • Real-time analysis to assess patient safety. • Time and motion analysis of surgical instruments. • Classification of pathology. • Hiatal hernias. • Capsule endoscopy.
Related Efforts: Cancer Screening • Skin caner screening. • Handheld iPhone image classifier. • Tool for primary care physicians. • Identify lesions in need of dermatology referral. • NIH and UMB proposals pending.
Image Classification Approach Feature Models Feature Extraction Images Organized by Class Model Features Image Classifier Feature Extraction Unknown Image
Image Features • Spectral features (color/tone). • Histogram (3D, color, binary, gray). • Distribution, size, width, mean, stdev. • Do not vary with translation and rotation. • Textural features (spatial distribution). • Gray-level co-occurrence matrix (GLCM). • Energy, entropy, contrast, correlation. • Independent of color distribution. IEEE Transaction on Systems, Man, and Cybernetics. 1973 Nov; 3(6):610-621
Advanced Features - Context • Image segmentation. • Regions of interest (contextual features). • Threshold algorithms - Maximum Entropy, Otsu Threshold, Watershed, etc. • Segmentation features of actin fibers. • Density - Area, Mean Gray Level. • Distribution - Centroid, Center of Mass. • Orientation - Angle, Elliptical Fit (wrt cell). • Order - Angle, Elliptical Fit (wrt fibers).
Advanced Features - Clustering • K-means clustering of image features. • Partitions images into clusters based on the nearest mean, based on a first-order Markov property. • Based on the assumption that images with similar clinical features are more likely to be found in the same cluster.
Model Development • Distance metrics • Manhattan distance, Jeffrey divergence. • Classification threshold. • Support vector machines • Machine learning methods. • An N-dimensional hyperplane optimally separates images into categories. • This mapping is performed by a set of mathematical functions, known as kernels.
Initial Results - Feature Analysis • Initial image classification experiment. • Evaluated 15 spectral and textural features. • Total of 11 images in 4 groups. • Focal adhesions images, actin stained. • 1hdry, 1hwet, 24hdry, 24hwet. • Analysis. • Leave-one-out technique over all 11 images. • Manhattan distance. • Threshold of 5% (0.3% for histograms).
Initial Results - Feature Analysis • Promising features. • Gray-scale distribution • Medium • Mode • Homogeneity • Energy • Entropy • Inverse difference moment Sensitivity = 76.8% Specificity = 89.6% Accuracy = 86.4%
Initial Results - Segmentation • Second image classification experiment. • Evaluating 4 new image features. • Density, Distribution, Orientation, Order • Experimenting with threshold algorithms to optimize image segmentation. • Total of 11 images in 4 groups. • Focal adhesions images, actin stained. • 1hdry, 1hwet, 24hdry, 24hwet.
Initial Results - Segmentation • Orientation feature using elliptical fit. • Image moment-preserving threshold. • Elliptical fit. • Cell angle = 132° • Average (weighted) actin fiber angle = 129°.
Initial Results - Analysis Platform • To automate and optimize image processing algorithms.
Future Efforts • Use feature analysis to develop a support vector machine image classifier. • Continue image segmentation work. • Correlate actin data to other images. • Incorporate successful algorithms in the Analysis Platform. • Identifyontologies to map specific classes to biological characteristics.