Download
1 / 21
220 likes | 422 Vues
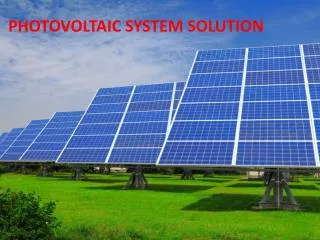
Snow Cover Mapping for Yield Forecasts and Photovoltaic System Monitoring. Georg Wirth University of Applied Science Munich georg.wirth@hm.edu. Outline. Influence of Snow on Monitoring PV Systems Monitoring of PV Systems Effects of a Snow Cover Available Snow Cover Datasets

E N D
Snow Cover Mapping for Yield Forecasts and Photovoltaic System Monitoring Georg Wirth University of Applied Science Munich georg.wirth@hm.edu
Outline • Influence of Snow on Monitoring PV Systems • Monitoring of PV Systems • Effects of a Snow Cover • Available Snow Cover Datasets • Validation of the Datasets • Snow Cover Mapping for Yield Prognosis • General Information on Yield Prognosis • Satellite Record Used for the Snow Cover Maps • Snow Cover Maps for Europe and the US Georg Wirth, georg.wirth@hm.edu
Monitoring PV-Systems • Monitoring is important due to financial reasons and will become necessary for grid stability • The actual yield of a PV-System can be calculated for a given solar radiation • Irradiance information is often derived from satellite data • Satellite data is advantageous because of its spatial information Georg Wirth, georg.wirth@hm.edu
G in W/m² P in kW Effects of Snow Cover 11.00 The upper half of the modules is free of snow 11.30 The modules are completely free Snow covered PV-System in Munich 05.03.2008 Georg Wirth, georg.wirth@hm.edu
LSA SAF and DLR show the best overall accuracy Both show the benefit of the high temporal resolution of Meteosat Global products show good values in Germany but have a low performance in difficult areas like Switzerland. Classification Accuracy 100 % 90 80 70 60 50 40 30 20 10 0 CGS DLR IMS LSA SAF MODIS NOAA Univ. STAR Oldenburg ■Germany ■Switzerland■total Georg Wirth, georg.wirth@hm.edu
Snow Cover Maps Snow cover in days / year Georg Wirth, georg.wirth@hm.edu
Yield Prognosis • For a yield prognosis it is common to use long time series of global irradiation data • Data based on satellite and / or ground measurements • A minimum of 5 years is recommended for significant results • Hardly information on snow cover available Georg Wirth, georg.wirth@hm.edu
Data Used for the Snow Cover Maps • NOAA / NESDIS • Interactive Multisensor Snow and Ice Mapping System (IMS) • Snow Cover Mapping since 1966 • Daily data on a 24 km x 24 km resolution since 1997 • Daily data on a 4 km x 4 km resolution since 2004 Georg Wirth, georg.wirth@hm.edu
Yearly Snow Cover Maps • Between 20 and 60 snow covered days in areas used for PV in Germany • Considerably more snow in the north of the US Bavaria: ~ 4 GW of PV installed 3,5 % of the yearly consumption Georg Wirth, georg.wirth@hm.edu
Monthly Snow Cover in Europe • Snow cover from November till March • Little losses in November because there are only few snow covered days • Small losses in December and January due to low zenith angle • Most losses appear in March since the is considerable radiation and snow cover Georg Wirth, georg.wirth@hm.edu
Thank you for your attention Georg WirthM. Sc. Munich University of Applied Science Department of Electrical Engineering georg.wirth@hm.edu www-lse.ee.hm.edu
Backup Georg Wirth, georg.wirth@hm.edu
Validation of the Datasets Georg Wirth, georg.wirth@hm.edu
False Alarm Rate (Snow not identified) upward Error due to underestimation (to much snow) downward The orientation around the zero line shows the handling of identified snow The error should be small and symmetrical LSA SAF has the most symmetrical pattern Total Error CGS DLR IMS LSA SAF MODIS NOAA Univ. STAR Oldenburg ■Germany ■Switzerland ■total Georg Wirth, georg.wirth@hm.edu
Snow Load Maps • Hardly information on snow cover duration available • Snow load maps are often used for a rough estimation of losses • The maps are not applicable as they show the maximum load and not the duration Georg Wirth, georg.wirth@hm.edu
Validation in with Data of Germany's National Meteorological Service (DWD) Georg Wirth, georg.wirth@hm.edu
Monthly Snow Cover in Europe Georg Wirth, georg.wirth@hm.edu
Yearly Snow Cover in Asia Georg Wirth, georg.wirth@hm.edu
Yearly Snow Cover in Europe Georg Wirth, georg.wirth@hm.edu
Yearly Snow Cover in the US Georg Wirth, georg.wirth@hm.edu