Decision Trees in Land Cover Mapping: Techniques, Benefits, and Challenges
430 likes | 602 Vues
This document explores the use of classification and regression trees for land cover mapping, focusing on the decision-making processes and methodologies involved. It highlights the advantages and disadvantages of decision trees, such as their rapid implementation and susceptibility to overfitting. The text details training data considerations, sampling strategies, and different tree approaches including single and multiple tree techniques. Furthermore, it underscores the utility of decision trees in mapping land cover, alongside accuracy assessment methods like cross-validation.

Decision Trees in Land Cover Mapping: Techniques, Benefits, and Challenges
E N D
Presentation Transcript
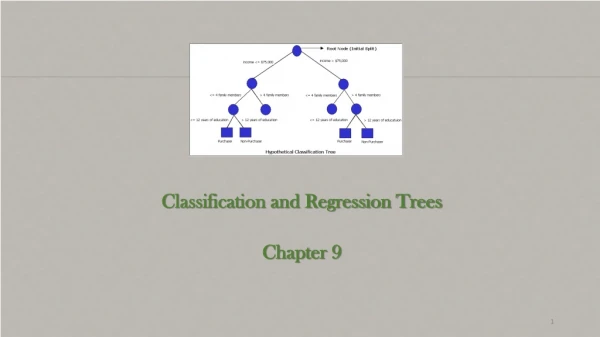
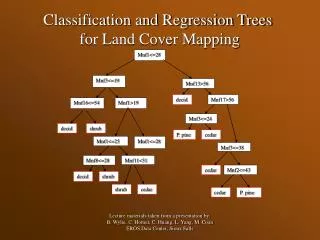
Mnf1<=28 Mnf3<=19 Mnf13>56 decid. Mnf17>56 Mnf16<=54 Mnf1>19 Mnf3<=24 decid. shrub P. pine cedar Mnf1<=25 Mnf1<=28 Mnf3<=38 Mnf8<=28 Mnf11<51 cedar Mnf2<=43 decid. shrub shrub cedar cedar P. pine Classification and Regression Trees for Land Cover Mapping Lecture materials taken from a presentation by: B. Wylie, C. Homer, C. Huang, L. Yang, M. Coan EROS Data Center, Sioux Falls
How do you eat an elephant? One bite at time! Divide & Conquer Stratify & Predict
6/7 = 86% Weight 6/6 = 100% Specific Gravity Classification Trees Separating Apples and Oranges (Lemons?)
Example Decision Tree True False Mnf1<=28 Mnf3<=19 Mnf13>56 decid. Mnf17>56 Mnf16<=54 Mnf1>19 Mnf3<=24 decid. shrub P. pine cedar Mnf1<=25 Mnf1<=28 Mnf3<=38 Mnf8<=28 Mnf11<51 cedar Mnf2<=43 decid. shrub shrub cedar cedar P. pine
Advantages of Decision Trees • Rapid • Repeatable • Nonparametric • Utilize categorical data • Non-linear relationships • Less sensitive to errors in training data Disadvantages of Decision Trees • Lots of training • Over-fitting • Weights toward the relative % of training data • Short-sighted (stepwise methods fail to identify optimal subset regressors –Fox,1991)
Other Methods: Unsupervised Clustering + Cluster busting can be time consuming + Cluster interpretation is subjective + Cannot include categorical inputs + Difficult to interpret if multiple date or if non spectral data include (DEM) + Parametric (assumes normal distribution) Supervised Classification + Parametric (assumes normal distribution) + Cannot include categorical inputs + Problematic multiple date or if non-spectral data include (DEM) + Difficult for large area applications
Training data: capture variability of a class (sample size) Spectral variability: A monoculture of wheat
Would 2 examples of each produce a reliable separation? Predictor 2 Predictor 1
Training samples Classification tree is a “Data Mining” method so it performs well with large training data sets. Sampling of classes should reflect their relative frequency in the study area. rare classes = few training points common classes = many training points Adequate but not over sampling of rare classes Samples should be widely distributed over the study area to minimize autocorrelation effects on the surface and on the image
Descriptive or Prediction decision trees? (De’ath and Fabricus 2000) DESCRIPTIVE TREES: 1) Usually a single tree 2) The objective is to understand important factors or functional relationships between predictor and dependent variables. 3) The decisions generated by the tree are as important as the predictions
PREDICTION TREES: • The objective is the Best Possible Prediction of the dependent variable • Usually consists of a combination of multiple trees aimed at producing higher accuracies and more stable and robust models (DeFries and Chan 2000)
Multiple Tree Approaches: Prediction • Bagging (bootstrap sampling of training data)--Splus & C5 • Subset data layers—Splus & C5 • Boosting* – C5
Multiple Tree Approaches: Prediction 2) Subset of data layers—Splus & C5 Tree 1 V O T E soils Tree 2 spectral Tree 3 LUDA
Multiple Tree Approaches V O T E 3) Boosting (iterative trees try to account for previous trees errors)—C5 Different over-fitting issues associated with each tree tend to be averaged out.
Single tree Boosted
Boosting versus Single Tree (USGS NLCD Zone 16, Independent Test Data)
Mnf1<=28 Mnf3<=19 Mnf13>56 decid. Mnf17>56 Mnf16<=54 Mnf1>19 Mnf3<=24 decid. shrub P. pine cedar Mnf1<=25 Mnf1<=28 Mnf3<=38 Mnf8<=28 Mnf11<51 cedar Mnf2<=43 decid. shrub shrub cedar cedar P. pine Trees provide more than just land cover predictions At each “terminal node” or “leaf” we: + know the number of training points correct, incorrect, and % right
% right or confidence “leaf” map land cover Since each terminal node is coded with a probability, a confidence map can be generated Identifies terminal node number for each decision Model output
Use relative frequency of use of data layers in the training data as a crude index of data layer “utility”. Top “utility” data layers from 40 possible input layers • Reduce inputs to decision tree • Reduced tree may have improved accuracies • Increases speed that the tree can be applied to the study area • Interpretation of underlying functional relationships (drivers) • Produce multiple trees for class “voting”
Accuracy Assessment: Cross Validation versus Independent Test, Zone 16, Utah
Uses of Cross Validation • Accuracy Assessment • Optimal tree data sets • Pruning • All training data used for prediction Cautions • spatial autocorrelation • look for “significant” error changes when pruning or selecting tree parameters
Past Experiences: hierarchical implementation of trees Landsat 7 ETM+ Mosaic (band 5,4,3) Mapping Zone 60, Spring, 2000 and 2001
Forest and Non-Forest Classification Mapping Zone 60, 2001 Established a classification tree model for mapping forest and non-forest class using 1700+ FIA plot data (669 forest and 1100+ non-forest plots). The classification was run using a 5-fold cross-validation procedure. The agreement between mapped and reference/validation data is 95% with standard error (SE) less than 1.0%.
Forest Classification Based on NLCD 2000 Classification System Mapping Zone 60, 2001 Established a classification tree model for mapping three MRLC forest classes using 669 FIA plots and 5-fold cross-validation procedure (134 plots for validation for each of the 5 runs). The agreement between mapped and reference/validation data is 80% with SE 1.0%
Forest Type Group Classification Based on USFS classification System Mapping Zone 60, 2001 Established a classification tree model for mapping six forest type groups using 669 FIA plots and a 5-fold cross-validation procedure (134 plots for validation for each of the 5 runs). The agreement between mapped and reference/validation data is 65% with SE 2.3%
Leaf-on Landsat 7 ETM+ scene mosaic (bands 5,4,3) for mapping zone 16 – Utah/Southern Idaho
Forest/non-forest classification for mapping zone 16 – Utah/Southern Idaho Missclassification 0 * 16.8% 1 * 18.8% 2 * 19.1% 3 * 19.4% 4 * 16.3% Mean 18.1% SE 0.6%
Deciduous/evergreen/ mixed classification for mapping zone 16 – Utah/Southern Idaho Fold Decision Tree ---- ---------------- Size Errors 0 * 19.7% 1 * 19.9% 2 * 18.5% 3 * 19.4% 4 * 20.8% Mean 19.7% SE 0.4%
Forest type group classification for mapping zone 16 – Utah/Southern Idaho Fold Decision Tree ---- ---------------- Size Errors 0 * 31.9% 1 * 37.3% 2 * 36.8% 3 * 40.0% 4 * 31.9% 5 * 37.8% 6 * 33.0% 7 * 35.7% 8 * 35.5% 9 * 32.3% Mean 35.2% SE 0.9%
Mean and standard error (in parenthesis) of the overall accuracy (%) of classifications developed using a descriptive tree and an hierarchical tree approach in 5 repeated experiments. (Zone 16)
Recipe for Success • Adequate and representative training (adequately represent rare classes, preserve relative proportions of training and population) • Model construction assessed with Cross Validation • (boosting, pruning, and data layer exclusions) • Multiple trees for mapping (boosting) • Visually inspect land cover and add training in miss-classified areas and reconstruct model • Consider “hierarchical” trees to allow trees to focus on problematic separations
ACCURACY ASSESSMENT • Accuracy assessment is based on a 20% sample of training sites for each mapped type. • Since the 20% sample is not independent, this is not considered a true accuracy assessment. • The 20% sample or validation set is not used in the classification tree model development. • In addition to a validation with a 20% sample, we have supported our findings with a manual 5-fold cross validation with sample replacement to test model stability and help understand the effects of validation sample size on the model stability results.
Each site is considered correctly classified if the majority of pixels agree with sample polygon
Summary Statistics, 5-fold Validation This is a 5-fold cross validation with sample replacement to test model stability and help understand the effects of validation sample size on the model stability results.
% of area mapped vs. available sample size (Great Salt Lake Desert)
Conclusions • Current validation shows between 60-65% “accuracy” for completed mapping zones. • Variance of accuracies is directly linked to validation sample size. • A validation set of 40 points seems to provide some stability to model results. • A minimum of 40 samples for validation per cover type should be a target size. This is difficult due to the preponderance of “rare” types and the lack of training sites. • Using a 20% validation set, we need a minimum of 200 field sites per mapped type. This is difficult given the availability of unique sample sites for a particular cover type. • Overall map “accuracy” seems to coincide with expected results given the map detail. • Rare ecological systems and systems that consist of a wide range of cover types (I.e. shrub steppe types) tend to lower accuracies.