Download
1 / 16
160 likes | 353 Vues
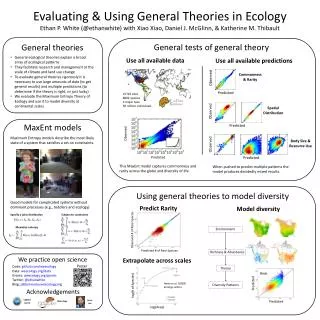
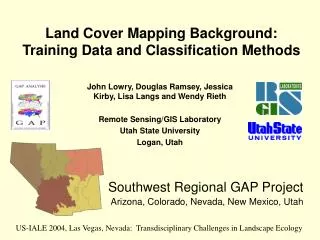
UTL. Mapping Spatial Distribution of Land Cover Classification Errors. Maria João Pereira, Amílcar Soares CERENA – Centre for Natural Resources and Environment. Introduction. Classificaon. Land Cover Maps. Confusion Matrix.

E N D
UTL Mapping Spatial Distribution of Land Cover Classification Errors Maria João Pereira, Amílcar Soares CERENA – Centre for Natural Resources and Environment
Introduction Classificaon
Confusion Matrix Table 1. Confusion matrix. Class labels: A – coniferous forest; B – deciduous forest; C – grassland; D – permanent tree crops; E– non-irrigated land; F – irrigated land; G – artificial areas; H – water; I – maquis and mixed forest.
Geostatistics • indicator kriging with locally varying means to integrate the image classifier’s posterior probability vectors and reference data (Kyriakidis & Dungan, 2001) • SIS with prediction via collocated indicator cokrigingfor updating cover type maps and for estimation of the spatial distribution of prediction errors (Magnussenand De Bruin, 2003)
Objective Mapping the spatial distribution of classification errors based on stochastic simulation and that takes into account: • the spatial continuity of each land cover class errors. • Varying errors’ patterns over the classification area Classification error
Rationale Classification error Class A Class B
Mapping local mean error of thematic classe i Indicator kriging kriging weights experimental data errors ei(x0) Number of neibghour data
Mapping the spatial dispersion of classification error e(x) • Define a random path visiting each node u of the grid • For each location u along the path • Search conditioning data (point data and previously simulated values) and compute point-to-point covariances • Build and solve the kringing system conditioned to local varying means • Define local ccdf with its mean and variance given by the kriging estimate and variance • Draw a value from the ccdf and add the simulated value to data set • Repeat to generate another simulated realization
Mapping the spatial dispersion of classification error e(x) Mean image
Results Mean Variance
Final remarks • Geostatistics provides na adequacte framework to assess spatial accuracy • In areas with field data, its influence prevails over the error trend mi(x) and vice-versa; • The method succeeded to map the spatial distribution of classification errors accounting for: • the spatial continuity of each land cover class errors. • Varying errors pattern over the classification area
Project Landau - Contract Ref. PTDC/CTE-SPA/103872/2008 Thank you! maria.pereira@ist.utl.pt