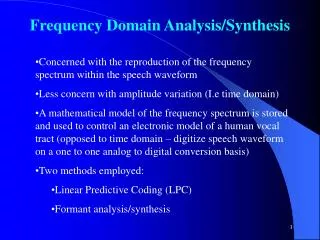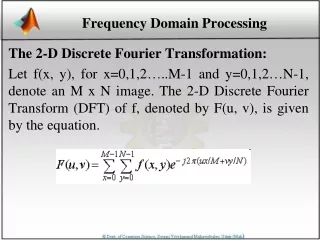
Frequency Domain Methods
Frequency Domain Methods. Inverse Fourier Transform: F --1. Time domain world. Fourier Transform: F. Frequency domain world. This transformation coud be made in real time by using hardware or in a post procesing scheme using software . Spectrum Analyser. Oscilloscope.

Frequency Domain Methods
E N D
Presentation Transcript
Inverse Fourier Transform: F--1 Time domain world Fourier Transform: F Frequency domain world This transformation coud be made in real time by using hardware or in a post procesing scheme using software Spectrum Analyser Oscilloscope
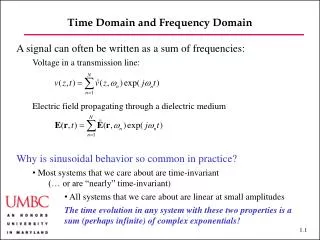
Time Domain Frequency Domain Amplitude Amplitude frequency time
Why go to the Frequency Domain • Frequency analysis can show characteristics of oscillator: • Noise processes • Side bands (modulation, parasitic) • Spectrum analyzer easy to use to show noise far from the nominal frequency. • Limited by the bandwidth of the measuring system.
Detection of parasitic signals • Parasitic signals simply adds to the signal • Parasitic signal modulates the signal • In either case, if the signal is far enough from the carrier (greater than the resolution of the spectrum analyser available) it can be resolved.
Sideband detection Sy(f) frequency
Line width problems Sy(f) frequency
Increase time of measurement Sy(f) frequency
Solution to limited spectrum analyzers • Record the data for a very long time using a time measurement system • Feed your data to a proper analyzer software. • Convert the time data into frequency data. • Interpret the results
Noise in frequency domain Spectral density of the phase fluctuations Spectral density of the frequency fluctuations
Noise in frequency domain • Not very useful to calculate the Allan variance from the spectral density of the noise • Very useful to detect anomalies in the noise pattern of a device
Types of phase noise Log scale Log scale frequency
Types of frequency noise Log scale Log scale frequency
Power Law Dependence of y() real noise -3/2 As measured by Allan Deviation y() 1/f noise -1 1/2 -1/2 0 White phase Flicker phase White freq. Flicker freq. Random walk freq. Noise type:
Frequency Analysisusing a spectrum analyser • Advantages of frequency analysis • Good detector of modulation/parasitic signals • Easier to look at high frequency noise • Can discriminate between white and flicker phase noise! • Disadvantages • Not very good for noise very close to the carrier
Some examples stressing the differences between time domain and frequency domain analysis
White vs Flicker phase noise Slope @-1 Slope = -1 Time domain ADev(t) ADev(t) Not very different t t
White versus Flicker phase noise Frequency domain No ambiguity here! Sf(f) Sf(f) f -1 f 0 f f
White and flicker phase noise • They are often present over the same time scale and are difficult to separate. • ADev is unable to do it. • FFT will tell quickly if white phase noise is present, which is very likely for most oscillators on short time interval. • This is true generally at high frequency offset from the nominal frequency.
Hydrogen maser example I • Case of a “sick” hydrogen maser • It has excess white or flicker phase noise. • ADev method of evaluation reveals higher than normal noise at short term. Unable to sort out white from flicker noise. • FFT of phase signal sorts out the type of noise
Hydrogen maser example II f0 or f-1 Which one?
Hydrogen maser example III f-3 f-2 f0 No f-4 No flicker phase noise f-1 amplitude ??
Hydrogen maser example IV • Frequency analysis has resolved the type of noise affecting the performance of the maser. • Frequency analysis has also revealed the presence of parasitic signals. • Some of it is due to some 4 seconds cycle operation within the phase comparator itself
Another way of looking at data:the moving FFT • Easy to implement • Can reveal intermittent problems
Moving FFT II Moving FFT over sixty days of phase residuals of two hydrogen masers reveals strange parasitic signal. Modulation period = one week Parasitic frequency not stable
Parasitic signal It turns out that this signal is generated in the path between one maser and the phase comparator. There are three buffer amplifiers and distribution boxes along the path. The one week amplitude modulation tends to point out to interference with normal activities in the building.
Conclusion • Frequency domain methods should be used as well as time domain methods • Both methods are complement of each other • Never miss the opportunity to look at your data from all angles possible.