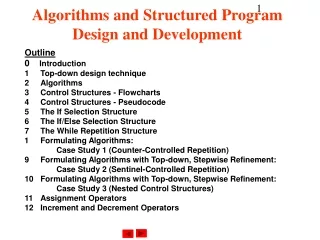
IT 0104-PROGRAM DESIGN AND DEVELOPMENT
IT 0104-PROGRAM DESIGN AND DEVELOPMENT. PURPOSE To provide basic knowledge for solving problems using computers and to impart the necessary skills for the development of applications. INSTRUCTIONAL OBJECTIVES

IT 0104-PROGRAM DESIGN AND DEVELOPMENT
E N D
Presentation Transcript
IT 0104-PROGRAM DESIGN AND DEVELOPMENT PURPOSE To provide basic knowledge for solving problems using computers and to impart the necessary skills for the development of applications. INSTRUCTIONAL OBJECTIVES • To understand the basic concepts of problem solving using computers and to learn different problem solving strategies • To discuss the importance of algorithms in the problem solving process • To identify the necessary properties of good algorithms • To use pseudo-code to implement, test, and debug algorithms for solving simple problems
Unit I-Problem Solving Concepts POINTS TO BE DISCUSSED: • What is a problem?-Types of problems • Problem Solving in everyday life. • Six steps for general problem solving • Problem solving concepts for computers- Constants, Variables, Operators, Hierarchy of operations, Data types, Equations, Functions, Expressions. • Organising Problems- Problem Analysis Charts, Structure/Interactivity Charts, IPO Chart, Algorithm, Flowcharts, Internal and External documentation
What is a PROBLEM • A state of difficulty that needs to be resolved • PROBLEMS EXIST WHERE GOALS NEED TO BE ATTAINED AND THERE IS UNCERTAINTY ABOUT SOLUTION
Problem Faced in Everyday in Life • People make decisions everyday • Examples: • Should I wear casual or formal today? • Should I watch TV or go out to cinema? • what career? • what course? • What shoes? • Everything needs a DECISION AS A SOLUTION TO THE PROBLEM
What happens when bad decisions are made? • WASTAGE OF TIME AND RESOURCES
Six steps to ensure a Best decision in PROBLEM SOLVING • Identify the problem • Understand the problem • Identify alternative ways to solve the problem • List instructions that enable you to solve the problem using selected solution • Select the best way to solve the problem from the list of alternative solutions • Evaluate the solution
What makes a good decision? • Well identified problem • All alternatives considered • Information overloaded – appropriate alternatives • Can the person carry out steps/instructions
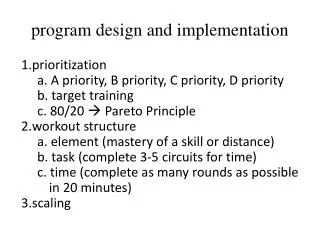
Approaches to solve a problem: • Algorithmic • Heuristic Important definitions Solutions that can be solved with a series of known actions are called Algorithmic Solutions Employing a self-learning approach to the solution of a problems is known as Heuristic Solutions
Examples Algorithmic solution: • To make a cup of coffee • To find largest of three numbers Heuristic solutions: • how to buy the best stock? • How to play chess?
Problem solving with computers Computers use algorithmic solutions • Program– set of instructions that make up solution to a problem • Results– outcome of running the program • Testing– Are the outcomes what you expected and correct • Documentation– two types • manual documentation – instructions telling users how to use the program
Problem solving with computers involves several steps Clearly define the problem. • Analyse the problem and formulate a method to solve it (see also .validation.). • Describe the solution in the form of an algorithm. • Draw a flowchart of the algorithm. • Write the computer program. • Compile and run the program (debugging). • Test the program (debugging) (see also verification.). • Interpretation of results.
Problem solving concepts for computers • Constants • Variables • Operators • Hierarchy of operations • Data types • Equations • Functions • Expressions
Constant: A variable whose value is determined when a program description is written and doesn’t change from that value during program execution. A constant is a value in a program, that stays the same throughout the program's execution-numeric, alphabetical, special symbols. Ex:PI=3.142857 Rules: Constant cannot be changed after it is initially given a value
Variable: a named location in memory for storing data. • Variables are values that can change as much as needed during the execution of a program. Ex:city=“chennai”
OUTPUT INPUT Information PROCESS Data Data vs. Information Processed meaningful report Unorganized facts
DATATYPE • A type is the “kind” of data that variable is allowed to hold.
Functions • Small sets of instructions that perform specific tasks and return values • Specify the basic tasks that are used repeatedly in the problem-solving process thus reducing time and improve the readability of the solution. • Function name(data) • Data used by the function are called parameters • Ex:sqrt(n),max(n1,n2,n3) • Divided into classes:
TYPES OF FUNCTIONS • Mathematical function: sqrt(n) ,abs(n),sign(n) • String function: Left(S,n),right(S,n),Length(S) • Conversion function: String(N),Value(S) • Statistical function: Average(list), Max(list), Sum(list) • Utility function: Date,Time,Error
Operators • Operators are symbols that indicate some kind of action is to be performed. • Data connectors within expressions and equations • Tell the computer how to process the data • What type of processing needs to be done • OPERANDS- data that the operator connects and processes • RESULTANT-answer of the operation.
3 – 2 =1 • - Subtraction • + Addition • * Multiplication • / Division • % Modulus • -- Decrement • ++ Increment • Power ^ 3 + 2 =5 3 * 2 =6 6 / 3 =2 3 % 2 =1 -- 2 =1 ++ 2 =3 2 ^ 2 =4
Relational Operators • > Greater than • < Less than • >= Greater than or equal • <= Less than or equal • == Equal • != Not Equal(<>)
Logical Operators • && AND A && B: result is true iff A and B are true, false otherwise • || OR A || B: result is false iff A and B are False, true otherwise • ! NOT NOT A: True if A is False
Hierarchy of operations • Functions • Power • Mod • *,/ • +,- • =,<,>,<=,>=.<> • NOT • AND • OR
EXPRESSION: An expression is a code segment that can be evaluated to produce a single value. Processes the data, the operands through the use of operators. ex:A + B EQUATIONS: stores the result of an expression in a memory location in the computer through the = sign. Ex:C=A + B
Evaluating Expressions b Calculate the area of the following figure x/2 x x
Evaluating Expressions x = 4 and b = 3 Area = x2 + x/2 * b 4 4 1: 42 = 16 1 3 2: 4/2 = 2 2 3: 2*3 = 6 16 4: 16 + 6 = 22 2 3 4 6 22
How computer stores data • Each variable name is given a memory location which can hold one and only one value at a time. • Internal memory is volatile • The data, information and programs are stored in external medium as FILES –program files and data files. • BUFFER-Temporary memory while transfering files from external to internal storage.
Communicating with computer What is a program? • A set of step-by-step instructions that directs the computer to perform tasks and produce results. What is a Programming Language? • A programming language is a set of rules that instructs a computer what operations to perform.
Syntax: Rules governing the computer oerating system,the language and the application BUG: It is an error Debugging:The process of locating and correcting an error.
Organising Problems Certain organisational tools can help us to solve problems :- • Problem Analysis Charts – a beginning analysis of the problem • Structure/Interactivity Charts – shows the overall layout or structure of the solution • IPO Chart – shows the input, the processing and the output • Algorithm – show the sequence of instructions comprising the solution • Flowcharts – graphic representations of the algorithms
Problem Analysis Chart (PAC)separates the problem in 4 parts
TASK :- 1) In Pairs create a Problem analysis chart for the average problem 2) Individually – create a Problem Analysis chart for calculating the Gross pay , given the formula GrossPay = Hours * PayRate
Interactivity(Structure) Chart • This breakdowns a complex problem into simpler tasks. • This divides your solution in modules – subtasks. Structure charts connect modules together to show the interaction of processing between the modules • Each module should contain the tasks to finish/accomplish one function - e.g calculating results, reading input • The control module controls the flow to other modules
Interactivity(Structure) Chart • KEY • Circle – iteration • Diagonal line – same module used twice • Diamond - selection TASK – 1) in pairs draw a structure chart for the Average problem 2) draw a structure chart for the Gross pay problem
Top-down method, here the program was executed form beginning to end. The user did not control the order of execution of the modules. The program was in control control Module 2 Module 4 Module 5 Module 3 Module 1 Module 6 Module 7 Module 3
PayrollControl Until no more emp Read Calc Print Interactivity chart for payroll problem(top-down method)
object-oriented programming – which is event driven – the user is in control. Modules are still used, within each module the execution is procedural Module6 Module7 Module3 Module2 Module1 Module3 Control Module4 Module5
Interactivity chart for payroll problem(Object-oriented solution) Payroll Control Print Read Calc
The IPO Chart. • This extends and organises the information in the problem analysis chart. • It shows in more detail what data items are input, what processing takes place on the data and what information will be the end result, the output. • In the IPO chart the output is the first to be completed and then the input and then the processing
Writing Algorithms After using the structure chart and the IPO chart the next step in organising the solution is to for the programmer to develop a set of instructions for the computer – called algorithms or Psuedocode. Algorithm: is a systematic procedure that produces - in a finite number of steps - the answer to a question or the solution of a problem. is a sequence of instructions which can be used to solve a given problem
Input Data Read Read student name Get Get student name Computer operations in Pseudocode
Output Information Print Print ‘Program Complete’ Write Write record to file Output Output totalAmount Display Display ‘Program Complete’ Computer operations in Pseudocode
Perform Arithmetic Add Add num1 to num2 Subtract Subtract num1 from num2 Multiply Multiply num1 by num2 Divide Divide num1 by num2 Computer operations in Pseudocode
Assign Values Initialise Initialise totalPrice to zero Set Set totalPrice to zero Store Store zero in totalPrice Computer operations in Pseudocode
Compare Values IF…THEN…ELSE IF num1 > num 2 THEN ADD num1 to toal ELSE ADD num2 to total ENDIF Computer operations in Pseudocode
Repeat Actions DOWHILE DOWHILE Num1 > Num2 ADD num1 to total Multiply total by 3 Subtract Num2 by 3 ENDDO Computer operations in Pseudocode