MDM4U FINAL PROJECT Two-variable co-relational study
MDM4U FINAL PROJECT Two-variable co-relational study. Name: Caroline Wojnas Date: June 5, 2013. My Co-relational Study. Main variable: Per capita total expenditure on health (PPP int. $) . My Co-relational Study. Variable 1: Life Expectancy at Birth for Both Sexes (in years)


MDM4U FINAL PROJECT Two-variable co-relational study
E N D
Presentation Transcript
MDM4U FINAL PROJECTTwo-variable co-relational study Name: Caroline Wojnas Date: June 5, 2013
My Co-relational Study Main variable:Per capita total expenditure on health (PPP int. $)
My Co-relational Study Variable 1:Life Expectancy at Birth for Both Sexes (in years) Variable 2:Maternal Mortality Ratio (per 100,000 live births) Interagency Estimates
3 REASONS: My career aspirations are tied to Healthcare This study allowed me to estimate the effectiveness of healthcare systems worldwide I’m passionate about world issues
Brief History Healthcare has always been an essential determinant in promoting the well-being of humans worldwide. Primary Secondary Tertiary Industries Advancements in science and technology has developed these industries, creating more effective healthcare systems.
Brief History Healthcare financing methods: general taxation to the municipality social health insurance private health insurance donations to health charities out-of-pocket payments
Brief History The more an individual pays for health services... the more benefits health is improved less risks are present
Brief History These improvements over time have lead to healthier people: lengthening life expectancies decreasing maternal mortality
Brief History The success of healthcare systems varies around the world due to: social conditions economic conditions health policies in effect
FUN FACT: Economy & Health Japan has the highest life expectancy 82.7 years Sierra Leone has the lowest life expectancy 46.53 years VS.
FUN FACTS: Canada’s Stats Ranked as 30thbest healthcare system in the world Per capita total expenditure on healthcare: 4520.0 (PPP int. $) Life expectancy of 82 years (for both sexes) Maternal mortality ratio is12 (per 100,000 live births)
FUN FACT: World Life Expectancy 70 years was the average life expectancy at birth of the global population in 2011!
HYPOTHESIS #1 • Per capita total expenditure on health (PPP int. $) vs. life expectancy at birth for both sexes: • I expect to see a strong, positive linear correlation.
HYPOTHESIS #2 • Per capita total expenditure on health (PPP int. $) vs. maternal mortality ratio (per 100,000 live births): • I expect to see a strong, negative linear correlation.
Variable 1 (Main Variable): Per capita total expenditure on health (PPP int. $)
Variable 2 (for comparison): Life Expectancy at Birth for Both Sexes (years)
Variable 3 (for comparison): Maternal Mortality Ratio (per 100,000 live births) Interagency Estimates
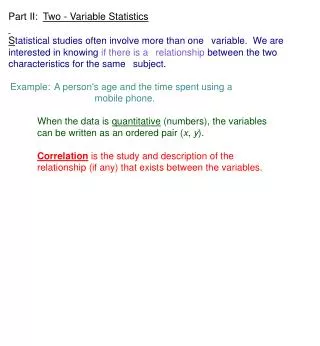
2 Variable Analysis independent variable: per capita total expenditure on health (PPP int. $) For this independent variable, a scatter plot versus each of the other two variables (dependent variables) follows this slide.
HYPOTHESIS #1 • Examining the first correlation I conducted in this study, which was between per capita total expenditure on health (PPP int. $) and life expectancy (in years), it appears that my analysis verifies my hypothesis.
HYPOTHESIS #1 • It is, in fact, a strong, positive linear correlation. • This relation is cause and effect. • A linear model suits this relationship best.
HYPOTHESIS #2 • The next correlation I conducted in this study was per capita total expenditure on health (PPP int. $) versus maternal mortality (per 100,000 live births). • My hypothesis needs to be modified.
HYPOTHESIS #2 • This correlation is actually moderate and negative, as r = -0.6134 • This relation is cause and effect. • Anexponential model would suit this relationship best.
EXAMINING SAMPLING TECHNIQUE • I sampled 50/196countries in the world. • Therefore, this sampling method can result in sample bias, not reflecting the exact characteristics of the population (all countries in the world).
EXAMINING MEASUREMENT METHODS • How variables are measured contributes to this bias: • (PPP int. $) • (years) for both sexes • (per 100,000 live births) interagency estimates
MY DATA SOURCE’S CREDIBILITY • I used the World Health Organization website www.who.int. • Renowned for providing health-related statistics!
ANY OUTLIERS? • SCATTER PLOT #1: one • SCATTER PLOT #2: unsuitable model
WAYS TO REMOVE SOURCES OF ERROR • Use the same data source • Use the same 50 countries for each variable • Obtain data for each variable from the same year • Use data from all countries
OTHER VARIABLES I WOULD LIKE TO COMPARE: • Disease ratios in countriesConditions such as: Tuberculosis, HIV/AIDS, Type 1 Diabetes • Nutrition-related statssuch as:Child Malnutrition ratios per country • Immunization coverage percentages by country for various illnesses such as: Hepatitis B (HepB3), Polio (Pol3), and Measles (MCV).
BIBLIOGRAPHY OF DATA SOURCES World Health Organization. N.p., May 2012. Web. 2 June 2013. <http://www.who.int/mediacentre/factsheets/fs348/en/index.html>. University of British Columbia Sauder School of Business Pacific Exchange Rate Service . N.p., 2011. Web. 2 June 2013. <http://fx.sauder.ubc.ca/PPP.html>. Health Financing: Health expenditure per capita by country. N.p., 2011. Web. 2 June 2013. <http://apps.who.int/gho/data/node.main.78?lang=en>. Life Expectancy by Country. N.p., 2011. Web. 2 June 2013. <http://apps.who.int/gho/data/node.main.3?lang=en>. Cause-specific mortality and morbidity: Maternal mortality ratio by country. N.p., 2010. Web. 2 June 2013. <http://apps.who.int/gho/data/node.main.15?lang=en>.