Download
1 / 46
460 likes | 604 Vues
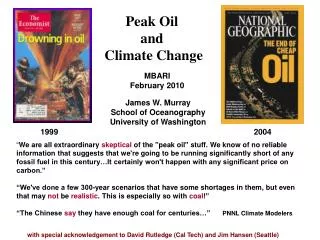
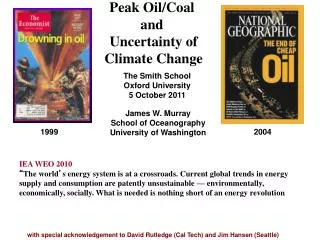
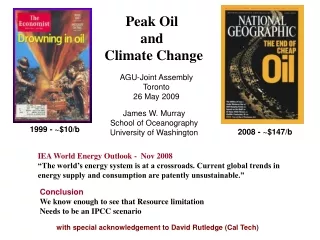
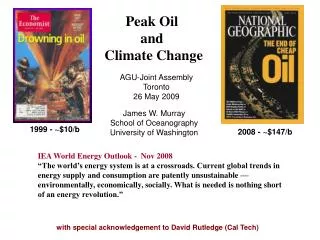
Peak Oil and Climate Change. AGU-Joint Assembly Toronto 26 May 2009. James W. Murray School of Oceanography University of Washington. 1999 - ~$10/b. 2008 - ~$147/b. IEA World Energy Outlook - Nov 2008

E N D
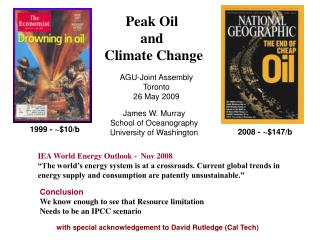
Peak Oil and Climate Change AGU-Joint Assembly Toronto 26 May 2009 James W. Murray School of Oceanography University of Washington 1999 - ~$10/b 2008 - ~$147/b IEA World Energy Outlook - Nov 2008 “The world’s energy system is at a crossroads. Current global trends in energy supply and consumption are patently unsustainable — environmentally, economically, socially. What is needed is nothing short of an energy revolution.” with special acknowledgement to David Rutledge (Cal Tech)
Outline • The 4th UN IPCC Assessment Report SRES Scenarios • Oil Reserves • Hubbert’s peak • The history of US oil production • How much oil and gas will the world produce? • The Coal Question • Discussion • Future carbon-dioxide levels • Conclusions
Oil Production in the IPCC Scenarios Gb = billions of barrels 1 barrel = 42 gallons = 159 liters In 13 scenarios, oil production is still rising in 2100 In none of the scenarios did oil production decrease because of resource limitation. None consider Peak Oil! Oil production is never going to be more than today. 28 3
CO2 emission Scenarios From Oil + Gas + Coal These Scenarios drive almost all climate change research
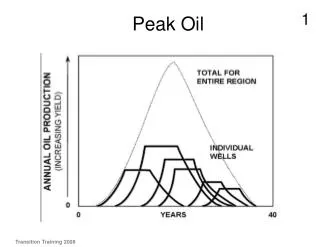
What is Peak Oil? It’s not about Reserves! It’s all about the Production Rate! We are not close to running out or oil
OPEC Oil “Proven” Reserves! Not proven by anybody! • 430Gb rise in reserves, no adjustment for 193Gb produced since 1980 • These questionable reserves are 45% of world oil reserves used by IPCC! • A recent leak of Kuwait Petroleum Company documents showed the actual reserves are only 48Gb (official reserves are 102Gb) • 1980 Kuwait reserves adjusted for production since then are 55Gb From BP Statistical Review Gb = billions of barrels
M. King Hubbert • Geophysicist at the Shell lab in Houston • In 1956, he presented a paper with predictions for the peak year of US oil production
A model logistic distribution Oil Fields Peak --- Regions Peak --- The World will peak Everyone agrees that world oil will peak – controversy on the date
Typo: Million! US Oil Consumption today is about 20 million barrels of oil/day ANWAR will not save us!
Hubbert’s Peak • From his 1956 paper • Hubbert drew bell-shaped curves by hand, and added up barrels by counting squares • For the larger estimate, he predicted a peak in 1970 • Hubbert has been much criticized there is no consideration of supply and demand curves, prices, or policy, and new technologies
US Crude-Oil Production Production is bell-shaped, like the curves Hubbert drew Average price after the peak was 2.6 times higher than before 11
The Logistic Curve or Rate Plot P/Q = mQ + a Q for which P/Q = 0 is 198 gigabarrels of oil. Also called Qt (maximum cumulative production) Half of this is 99 which occurred in 1973 Lower 48 A model for exponential growth in a finite system
225Gb ultimate 90% exhausted in 2011 Another Approach: Cumulative Oil Production Includes 48 + Alaska • EIA data from 1859 • Fit for cumulative normal gives the ultimate production and the time for 90% exhaustion 31Gb remaining USGS/MMS assessment 189Gb
Historical Projections for US Oil The power of Hubbert Linearization is that it uses past behavior of a system to indicate possible future performance rather than relying on the overoptimistic opinions of resource “experts” McKelvey Hubbert 14
Maximum Cumulative Production (Qt) Will Be 2165 Gigabarrels ½ Qt = 1083 Gb
Historical Fits for World Oil and Gas Ultimate Cumulative Ultimate Cumulative Production of Oil + Gas = 605 Gtoe Maximum cumulative through 2100 for an IPCC scenario is 2,600 Gtoe 17
Who are the experts that IPCC turn to? Energy Information Agency (EIA) - DOE International Energy Agency (IEA) – Paris US Geologocal Survet (USGS) - Washington Their models for future emissions are driven by demand (not supply). EIA, IEA and IPCC assume that supply will meet demand USGS assumes much oil yet to be found The EIA forecasts in 2008 projects a 30% increase in oil production between now and 2030 (from 85 to 97 mb/d) (D = +12 mbd). The hard truth is that increasing energy supply at all will be difficult. To have growth we need to balance decline of exisiting fields with discovery of new oil
Existing Oil Fields are in Decline Existing oil fields are declining at - 6.7% per year (IEA 2008) For 2005 to 2030 the world needs 45 mbd of new production – just to maintain flat production The projected growth requires discovery of 45 + 12 = 57 mbd of new oil! 57 ÷ 9 = ~6+ new Saudi Arabias
Urban Legend – we can drill more to get more oil Oil discoveries have been declining since 1964 The red box shows the average amount estimated to be discovered by the USGS each year between 1995 and 2025. The world’s oil provinces have been well explored. Future discoveries will be limited to smaller structures and deeper formations
What about coal? There are supposed to be hundreds of years of supply of coal! Big 3 Reserves: US (27%) Russia (17%) China (13%) then India, Australia, South Africa Remarkably the data-quality is very poor globally but especially for China and SE Asia and FSU
We also have a big problem with coal. The Reserves may not be as large as We’ve been led to believe. "Present estimates of coal reserves are based upon methods that have not been reviewed or revised since their inception in 1974, and much of the input data were compiled in the early 1970s. Only a small fraction of previously estimated reserves are actually minable reserves." from the National Academy of Sciences Report on Coal, June, 2007
Mt = millions of metric tons The average price after the peak is 2.4 times higher than before Britain now imports 74% of the coal it burns UK Coal Production 23
Projections vs Reserves for World Coal • UN IPCC scenarios assume 18Tboe is available for production from D. Rutledge
The scenario report SRES (2000) references the 1995 and 1998 WEC surveys Downward trend in proved recoverable reserves The IPCC chose to use additional recoverable reserves and they also chose 1998 (3,368Gt) instead of 1995 (680Gt) — additional recoverable reserves are now 19 times smaller than in 1998 Where Does the IPCC Get Its Coal Numbers? 26
Many independent groups are coming to the same conclusion Uppsala – Kjell Aleklett Peak Coal in 2030 (examples follow) http://www.tsl.uu.se/uhdsg/Publications/Coalarticle.pdf Energy Watch Group (EWG-Germany) Peak Coal in 2025 http://www.energywatchgroup.org/files/Coalreport.pdf Institute of Energy (IFE) Kavakov and Peteves (2007) The Future of Coal http://ie.jrc.ec.europa.eu/ Richard Heinberg Post Carbon Institute (book in progress) http://www.richardheinberg.com/museletter/195
Historical fits for Oil, Gas, and Coal Ultimate Production Reserves BP for oil and gas WEC for coal Fits for ultimate Projection Half-Way 2019 Cumulative oil, gas, and coal Projection Cumulative coal 28 Ultimate Production of oil + gas + coal = 938 Gtoe
Comparing with the IPCC Scenarios • This projection has lower emissions than any of the 40 IPCC scenarios • This is still true even with full coal reserves Projection
460ppm 440ppm Projection 50% Stretch-out for Fossil Fuel Burning Carbon-Dioxide Levels • Simulations with the program MAGICC from Tom Wigley at the National Center for Atmospheric Research (NCAR) in Boulder • This program was used in the earlier UN IPCC Assessment Reports • The program modified to use Rutledge projection for fossil-fuel emissions • profiles are business-as-usual for other greenhouse gases
Conclusions: 1) Supply Limitation will be serious Existing scenarios and energy policies are based on emissions - not supply We know enough to see that Resource Limitation needs to be an IPCC Scenario Peak Oil has occurred or will occur soon. Coal Reserves are significantly less than assumed by the IPCC. 2) Coal is thought of as a solution to energy needs – This will be a disaster for climate change without CO2 sequestration. Is CO2 sequestration realistic? 3) Energy will pass climate change as the hot button issue We have to get our energy plan in order before we can move forward on climate change 4) Energy Supply will Buffer Economic recovery Recessions correlate with price rise results in energy > 5.7% of GDP 5) Security Issue: Seven nations control 75% of world’s oil exports. There will be shifts in global power and wealth
Energy as a buffer on economic growth James Hamilton (UCSD) – Recessions generally correlate with the price of oil. If energy expenditures rise faster than income, then the share of income for other things must decline Oil Expenditures as a % of GDP
EIA Data: Demand for oil exceeded supply beginning in 2005. It topped out in early 2008 which was when the recession started and the price maxed at $147.
Summary Table: IPCC SRES versus Rutledge All values given in Gigabarrels of Oil Equivalents (Gtoe) 1990 Identified Additional Additional Additional Cumulative Resources Recoveries w/Technology Occurrences IPCC Oil+Gas 120 + 612 = 732 262 (low) 679 (high) 690 >20,107 (with marine CH4 hydrates) Coal 124 + 545 = 669 1905 3571 RutledgeUltimate Cumulative Oil+Gas+Coal = 938 Oil + Gas = 605 (from 938 – 666) Comparable to 732 from above Coal = 333 Comparable to 669 above IPCC values in ZJ, converted to Gtoe using 42 GJ/toe and 0.5 toe/t for coal ZJ = 1021 J For oil: 7.33 barrels per metric ton
MAGICC Simulations for CO2 and Temperature Written by Tom Wigley at the National Center for Atmospheric Research (NCAR) in Colorado This program has been used in the IPCC assessments Simulation parameters IPCC “most likely value” temperature sensitivity: 3C/2CO2 concentration (“likely” range is 2.0 to 4.5) Aslam Khalil’s recent measurements for CH4 equilibrium concentration: 1,750ppb Tom Wigley’s P50 values (IPCC scenario medians) for other greenhouse gases: deforestation CO2 , N2O, NOx, VOCs, SO2, C2F6, HFCs, SF6 Our projection for CO2 emissions from oil, gas, and coal burning. 37
Economists say – as price goes up, more oil will be produced Elasticity has become virtually zero. It’s a market where supply rules. from Kenneth Deffeyes
Coal Resources for the IPCC Scenarios (Tboe), from Nakicenovic IPCC scenario coal resources are based on WEC survey categories IPCC resources have not been adjusted for the new WEC surveys 39
Important Reading that will change your outlook Matt Simmons (2005) Twilight in the Desert James Kunstler (2005) The Long Emergency Jeff Rubin (2009) Why the World is About to get a Whole Lot Smaller: Oil and The End of Globalization Important web-site www.theoildrum.com
Hubbert’s Model P = annual production Q = cummulative production to some year Plot P/Q versus Q From 1958 onward – negative trend Oil from Lower 48 US States – Data from EIA Web Site
“We are all extraordinary skeptical of the "peak oil" stuff. We know of no reliable information that suggests that we're going to be running significantly short of any fossil fuel in this century…It certainly won't happen with any significant price on carbon.” “We've done a few 300-year scenarios that have some shortages in them, but even that may not be realistic. This is especially so with coal!”“The Chinese say they have enough coal for centuries…The idea that we're only going to reach 450 ppm is not defensible, especially when we're already around 385 ppm. Do we really think there is only another 60 years of fossil fuel left? I don't think so.” PNNL Climate Modelers …but, see my figures!
Mad Max Excluded “The scenarios are intended to exclude catastrophic futures that involve large scale environmental or economic collapses. In such scenarios GHG emissions might be low because of negative economic growth, but it seems unlikely they would receive much attention in the light of more immediate problems. Hence, this report does not analyze such futures.” IPCC
Nested Assumptions Energy scarcity is a myth Fossil Fuels are superabundant No reason to hoard or fight over them Globally traded from haves to have-nots Coal can be converted to anything Fuel will remain cheap for a century
What controls the price of oil? Supply versus Demand on International Market Backwardation – during price increase Contango – is not a place in Chile! Tanker Storage Possible Driver of a Future Price Crash See: www.gasbuddy.com
The current price is within 10% of the trend line for the last decade. The trend line is at $80 / barrel which is considered the recession threshold