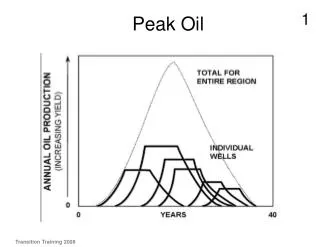
Peak Oil
Peak Oil. Economic, Geopolitical and Societal Aspects Dr. Robert J. Brecha University of Dayton. Chautauqua Course, May 22-24, 2006. Outline. Economics Prices Futures Elasticity Societal Effects Geopolitics Social Justice. Total. ~400 Quadrillion Btu. Coal. Geothermal, wind

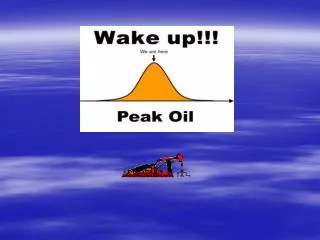
Peak Oil
E N D
Presentation Transcript
Peak Oil Economic, Geopolitical and Societal Aspects Dr. Robert J. Brecha University of Dayton Chautauqua Course, May 22-24, 2006
Outline • Economics • Prices • Futures • Elasticity • Societal Effects • Geopolitics • Social Justice
Total ~400 Quadrillion Btu Coal Geothermal, wind solar, etc. Gas Biomass RE Nuclear Hydro Oil World Energy Use
US Energy Use Residential Med./hvy trucks Commercial Air Light vehicles Transportation Industrial ~2/3 of oil use is transportation (Water, pipeline, rail, buses)
New Territory In the history of oil use, we have never before experienced a prolonged period of ever-increasing oil prices
Prices of Oil BP Statistical Review of World Energy June 2005, p. 14
GDP and Miles Driven http://www.theoildrum.com/story/2005/10/22/235239/89
Higher Prices, More Oil? The Law of Supply ? The “price-reserves relationship has its limits, because oil is found in discrete packages (reservoirs) as opposed to the varying concentrations characteristic of many minerals. Thus, at some price, world reserves of recoverable conventional oil will reach a maximum because of geological fundamentals. Beyond that point, insufficient additional conventional oil will be recoverable at any realistic price.” “PEAKING OF WORLD OIL PRODUCTION: IMPACTS, MITIGATION, & RISK MANAGEMENT” Hirsch, Bezdek, Wendling (contracted report for DOE)
Law of Supply? Ceteris paribus, if the price of a commodity increases, supply will increase. “… cumulative discovery explains approximately 70 per cent of the quadratic Hubbert curve for discovery over time for the US lower 48 states, whereas the price of oil is an inelastic factor … Roughly 99 per cent of oil production over time is explained by cumulative oil production. …(T)he price of oil is a fairly inelastic factor in determining production. … The Hubbert curve can be thought of as a limit of production.” Translation: Geology, not economics, is the limiting factor for both oil discovery and for production From D. Reynolds, Using non-time-series to determine supply elasticity: How far do prices change the Hubbert curve?, OPEC Review, June 2002, p.147-167
Dramatic Improvement in Oil Field Technology 3.5 Production 3.0 2.5 70 2.0 Billions of barrels / year 1.5 Price 1.0 2002 dollars per barrel 0.5 0 0 1950 1960 1970 1980 1990 2000 U.S. Production vs. Price “PEAKING OF WORLD OIL PRODUCTION: IMPACTS, MITIGATION, & RISK MANAGEMENT” Hirsch, Bezdek, Wendling
Law of Demand • Ceteris paribus, if the price of a commodity increases, demand will decrease. • “This paper uses a multiple regression model … to estimate both the short-run and long-run elasticities of demand for crude oil in 23 countries. The estimates so obtained confirm that the demand for crude oil internationally is highly insensitive to changes in price.” John C.B. Cooper, “Price Elasticity of Demand for Crude Oil: Estimates for 23 Countries” OPEC Review March 2003
How Have We Reacted Previously? Data from EIA and Transportation Energy Data Book, 24th ed.
GDP vs. GPI http://www.redefiningprogress.org/projects/gpi/ http://en.wikipedia.org/wiki/Genuine_Progress_Indicator
GPI Indicators Environmental Quality Greenhouse Gas Emissions Sustainable Transportation Ecological Footprint Analysis Air Quality Water Quality Solid Waste Socioeconomic Income Distribution Debt, External Borrowing, and Capital Movements Valuations of Durability Composite Livelihood Security Index Social Capital Population Health Educational Attainment Costs of Crime Human Freedom Index Time Use Economic Value of Civic and Voluntary Work Economic Value of Unpaid Housework and Child Care Work Hours Value of Leisure Time Natural Capital Soils and Agriculture Forests Marine Environment/Fisheries Energy http://www.gpiatlantic.org/#indicatorlist
Income and happiness in the USA • GDP per head • ($, 2001 prices) Richard Layard, LSE % very happy
The Hirsch Report “PEAKING OF WORLD OIL PRODUCTION: IMPACTS, MITIGATION, & RISK MANAGEMENT” R.L. Hirsch, R. Bezdek, R. Wendling (Feb. 2005) We cannot conceive of any affordable government-sponsored "crash program" to accelerate normal replacement schedules so as to incorporate higher energy efficiency technologies into the privately-owned transportation sector; significant improvements in energy efficiency will thus be inherently time-consuming (of the order of a decade or more).
Auto Lifetime Transportation Energy Data Book, 24th Ed.
Driving Habits vs. Hybrids But … if the decline rate is 3 – 5 %/year? Scenario one: Fleet grows by 0.5%/yr; no hybrids; driving amount remains const. at 11,600 mi/veh/yr Scenario two: Fleet grows by 0.5%/yr; hybrids incr. at 25%/yr.; driving amount remains const. at 11,600 mi/veh/yr Scenario three: Fleet grows by 0.5%/yr; no hybrids; driving cut by 10% one time to 10,440 mi/veh/yr Scenario four: Fleet grows by 0.5%/yr; no hybrids; driving cut by 2%/yr from 11,600 mi/veh/yr
Fuel Economy by Speed Driving at 60 mph instead of 70 mph could save roughly 500,000 barrels of oil each day Transportation Energy Data Book, 24th Ed.
Food Transportation: Zero-order • 35,000 lb. truck (empty) can haul 45,000 lbs. of freight at 5 mpg. • We consume ~2500 lbs. of food per year • Avg. of 1500 miles for food shipment • 17 gal. of gas for transportation per year • Compare to 57 boe or 2400 gal. (0.7%)
Food, Part II • We consume 3500 Cal (kcal) per day • Equivalent to 5.1 million Btu per year • Input energy ~10x or 51 million Btu/year • Oil/fuel - ~140,000 Btu/gal • Fuel input to food production = ~370 gal. • 17 gal. transport/370 gal. production = 4.5%
Our Oil Comes From … • Canada (790 × 106 bbl) • Mexico (600 × 106 bbl) • Saudi Arabia (560 × 106 bbl) • Venezuela (550 × 106 bbl) • Nigeria (420 × 106 bbl) • 93 other countries (2000 × 106 bbl) • Including - Switzerland (8000 bbl) 2005 EIA data; total imports for the year were 4.9 × 10⁹ barrels
China Economic growth in China, if that growth is coupled to increased use of fossil-fuel energy, has major implications for demand.
Iran GDP/capita: $8100 (2005, PPP)
Persian Gulf http://www.eia.doe.gov/emeu/cabs/pgulf.html
Economy and Energy I Bermuda Luxembourg Qatar US Neth. Antilles Bahrain
Human Development Index 1.2 billion 0.5 billion 4.2 billion 0.5 billion (31 African countries) Data from UNDP Human Development Report 2005, http://hdr.undp.org
What do we tell them? There has been an explicit promise made to developing countries – “we are wealthy, but you can become wealthy as well.” Given that GDP correlates to some extent with energy use (perhaps more so for lower GDP countries), if the energy sources are not as readily available in the future, or become prohibitively expensive, how can wealthy countries continue to hold out the hope of increasing prosperity?