Download
1 / 69
710 likes | 925 Vues
Peak Oil. A Primer Dr. Robert J. Brecha Physics Dept. University of Dayton. UD Physics Dept. Seminar – Jan. 20, 2006. Outline. Basic background (Where are we?) Models and predictions (Where are we going?) Economics (Maybe somebody knows …) Alternatives (How else might we get there?)

E N D
Peak Oil A Primer Dr. Robert J. Brecha Physics Dept. University of Dayton UD Physics Dept. Seminar – Jan. 20, 2006
Outline • Basic background (Where are we?) • Models and predictions (Where are we going?) • Economics (Maybe somebody knows …) • Alternatives (How else might we get there?) • Conclusions
Subtext • How do we use our technical and scientific background to look at complex, ill-defined problems? (Peer-reviewed work, physical principles) • Can we contribute to the discussions about possible declining natural resources as educators, even if the details are outside our specialty? (EROEI, thermodynamics vs. economics) • Is this really new, or have we already been here before?
Total ~400 Quadrillion Btu Coal Geothermal, wind solar, etc. Gas Biomass RE Nuclear Hydro Oil World Energy Use
US Energy Use Residential Med./hvy trucks Commercial Air Light vehicles Transportation Industrial ~2/3 of oil use is transportation (Water, pipeline, rail, buses)
Human Development Index and Energy Use 1.2 billion 0.5 billion 4.2 billion 0.5 billion (31 African countries) Data from UNDP Human Development Report 2005, http://hdr.undp.org
GDP vs. Miles Driven (US) http://www.theoildrum.com/story/2005/10/22/235239/89
US Yearly Petroleum Production US Energy Information Agency: http://www.eia.doe.gov/oil_gas/petroleum/pet_frame.html
Many Countries Have Peaked! The Countdown for the Peak of Oil Production has Begun – but what are the Views of the Most Important International Energy Agencies W. Zittel, J. Schindler, L-B-Systemtechnik, 12 October 2004 (zittel@lbst.de; schindler@lbst.de)
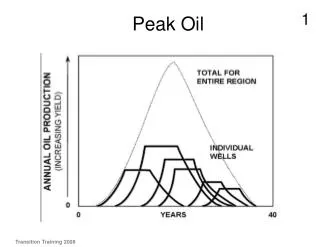
Peak Models USGS BP
Hubbert’s Logistic Curve “Economic” argument: We will always find more and increase ultimate recovered amount 1980 Prediction
Problem with Logistic Curves At early stages, curves for widely differing total amounts may look very similar. There are too many free fitting parameters
Hubbert Linearization Q (Gbbl) http://www.theoildrum.com/story/2006/1/11/6047/13568
OPEC Proved Crude Oil Reserves Energy Information Agency, posted March 2005, January 1, 1980 - January 1, 2005 Estimates
www.ihs.com US Geological Survey Estimates Bentley, Global Oil and Gas Depletion – an Overview, Energy Policy30 (2002)
One Prediction (1998) R.C. Duncan and W. Youngquist,“Encircling the Peak of World Oil Production,” Natural Resources Research 8, 219-233 (1999). Also by the same authors: “The World Petroleum Life-Cycle” http://www.dieoff.com/page133.pdf
Finding Norways R.C. Duncan and W. Youngquist, “The World Petroleum Life-Cycle” http://www.dieoff.com/page133.pdf
BP claims the world has only 40 years worth of oil at current extraction rates Reserves-to-Production Ratio BP Statistical Review of World Energy June 2005, p.40
Keep Watching… http://www.theoildrum.com
Peak “Good” Oil A somewhat fuzzy story, but it appears that the peak in production of light,sweet crude oil is already past. OPEC Monthly Oil Market Report, August 2005
New Territory In the history of oil use, we have never before experienced a prolonged period of ever-increasing oil prices
1989 1987 2005 1991 1986 Predictability?
Higher Prices, More Oil? The Law of Supply ? The “price-reserves relationship has its limits, because oil is found in discrete packages (reservoirs) as opposed to the varying concentrations characteristic of many minerals. Thus, at some price, world reserves of recoverable conventional oil will reach a maximum because of geological fundamentals. Beyond that point, insufficient additional conventional oil will be recoverable at any realistic price.” “PEAKING OF WORLD OIL PRODUCTION: IMPACTS, MITIGATION, & RISK MANAGEMENT” Hirsch, Bezdek, Wendling (contracted report for DOE)
Higher Prices Will Drive Discovery? “Cumulative discovery is used as an information and depletion indicator that determines the Hubbert curve …Technology and regulatory effects are added …Price and other variables are added to determine how powerful price is for changing the Hubbert supply model, both for discovery and production … The Hubbert curve can be thought of as a limit of production.” Translation: Geology is the limiting factor From D. Reynolds, Using non-time-series to determine supply elasticity: How far do prices change the Hubbert curve?, OPEC Review, June 2002, p.147-167
Dramatic Improvement in Oil Field Technology 3.5 Production 3.0 2.5 70 2.0 Billions of barrels / year 1.5 Price 1.0 2002 dollars per barrel 0.5 0 0 1950 1960 1970 1980 1990 2000 U.S. Production vs. Price “PEAKING OF WORLD OIL PRODUCTION: IMPACTS, MITIGATION, & RISK MANAGEMENT” Hirsch, Bezdek, Wendling
How Have We Reacted Previously? Data from EIA and Transportation Energy Data Book, 24th ed.
The Hirsch Report “PEAKING OF WORLD OIL PRODUCTION: IMPACTS, MITIGATION, & RISK MANAGEMENT” R.L. Hirsch, R. Bezdek, R. Wendling (Feb. 2005) We cannot conceive of any affordable government-sponsored "crash program" to accelerate normal replacement schedules so as to incorporate higher energy efficiency technologies into the privately-owned transportation sector; significant improvements in energy efficiency will thus be inherently time-consuming (of the order of a decade or more).
Auto Lifetime Transportation Energy Data Book, 24th Ed.
Driving Habits vs. Hybrids But … if the decline rate is 3 – 5 %/year? Scenario one: Fleet grows by 0.5%/yr; no hybrids; driving amount remains const. at 11,600 mi/veh/yr Scenario two: Fleet grows by 0.5%/yr; hybrids incr. at 25%/yr.; driving amount remains const. at 11,600 mi/veh/yr Scenario three: Fleet grows by 0.5%/yr; no hybrids; driving cut by 10% one time to 10,440 mi/veh/yr Scenario four: Fleet grows by 0.5%/yr; no hybrids; driving cut by 2%/yr from 11,600 mi/veh/yr
Fuel Economy by Speed Driving at 60 mph instead of 70 mph could save roughly 500,000 barrels of oil each day Transportation Energy Data Book, 24th Ed.
Natural Gas National Petroleum Council (1998) US Prod. Import from Canada 1998 19 Tcf 3 Tcf 2010 25 Tcf 4 Tcf 2015 27 Tcf Now the numbers are more like … 1998 19 Tcf 2003 19 Tcf 2008 15 Tcf And Canada peaked in 2001 at ~5 Tcf and expects a decline of 2.5% per year
Natural Gas in the US (per day) EIA Statistical Review of World Energy data
Tar Sands • Alberta, Canada + Venezuela • Effectively a mining operation • Current production of 600,000 bbl/day of synthetic crude oil • Estimates of 2 – 3 MMb/d in 10 – 20 years if all goes well. • Needs large amounts of NG and water, plus hazardous waste disposal The plan now is to expand capacity from the present 155,000 barrels a day to more than 500,000 by 2015. This will require many billions of dollars of further investment in mining and upgrading facilities. Malcolm Brinded Executive Director Exploration & Production, Royal Dutch Shell plc http://www.shell.com/static/media-en/downloads/speeches/mb_oxford_energy_seminar.pdf
Oil Shale • Western U.S. • Possibly 800 billion barrels !! • A mined product • Techniques proven in principle, but not at large scale • Only profitable with oil >$75/bbl • High growth, optimum scenario – 106 bbl/d in 2025 or later. Rand Corp. report for US DOE, Nat’l. Energy Tech. Lab.
Hydrogen • Current US annual production: 10 Mt • accounts for 5% of natural gas usage • releases 100 Mt CO2. • Direct use for all US transport would require some 200 Mt/yr. • Mostly from reforming methane (NG) • Used for making ammonia (fertilizer); oil refining • Could use electricity to obtain H2 from H2O • Fuel cells • Expensive $3000/kW (gasoline engine: $30/kW) • Well-to-wheels efficiency current hybrid electric vehicles Physics Today, Dec. 2004 +Transportation Energy Data Book, 24th ed.
Ethanol Yield for ethanol from corn is ~70 GJ/ha (@9000 kgcorn/ha) Automobile + light truck transportation uses ~1.7×10¹⁰ GJ/a Quick calculation: we would need 2.4×10⁸ ha of land Currently we have in the US 1.2×10⁸ ha of cropland total But … the key point missing is the energy input. Ethanol from industrial-scale corn farming is an energy break-even, at best. Energy return on Energy invested (EROEI) ratio is ~1. D.Pimentel and T. Patzek, Natural Resources Research 14, 65-76 (2005) Shapouri - USDA “The Energy Balance of Corn Ethanol: An Update” Ag. Econ. Report 813
Wind Hydro Tar sands “Net energy from the extraction of oil and gas in the United States” Cutler J. Cleveland Energy30 (2005) 769–782 EROEI
Effects of Peak Oil – Scenario I Million boe/d
Scenario I Parameters First scenario, which could be referred to as a moderately changed business-as-usual energy future. Natural gas and oil peak in consumption in five years; the decline rate for each being 3%/year. Solar and wind energy grow at 10%/year, while nuclear power and coal as energy sources grow at 1%/year as is currently the case. Non-conventional oil and gas production increases are based on current optimistic estimates: shale oil and methane hydrates beginning commercial production in 10 years and increasing at 0.15 million boe/day/year, while tar sands oil production increases from the current level of 1 million boe/day by 0.2 million boe/day/year.
Coal Production Energy Information Administration – Annual Energy Review 2005 http://www.eia.doe.gov/emeu/aer/coal.html