Download
1 / 30
300 likes | 399 Vues
Explore two weighted regression approaches to study quality in systematic reviews. Understand how to balance statistical power and study classification for more accurate conclusions.

E N D
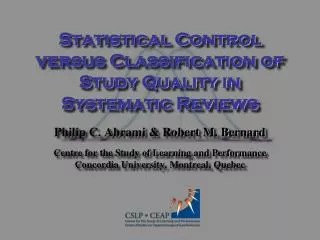
Statistical Control versus Classification of Study Quality in Systematic Reviews Philip C. Abrami & Robert M. Bernard Centre for the Study of Learning and Performance Concordia University, Montreal, Quebec
Abstract This presentation addresses a problem that exists in many meta-analyses: How to deal with variable study quality. Two approaches, both involving weighted regression, are suggested and an example of one is provided.
In the beginning, God created the heaven and the earth. And God saw everything that he made. "Behold," God said, "it is very good". And the evening and morning were the sixth day. And on the seventh day God rested from all His work. His archangel came then unto Him asking, "God, how do you know that what you`ve created is "very good”? What are your criteria? On what data do you base your judgment? Just exactly what results were you expecting to attain? And aren`t you a little close to the situation to make a fair and unbiased evaluation?” God thought about these questions all that day and His rest was greatly disturbed. On the eighth day God said, "Lucifer, go to hell." (Halcolm)
Power • Avoiding Type I & Type II errors • Power is affected by sample size among other things. • Low power increases the risk of failing to find: • Overall significant ES • Heterogeneity of ES • Explanatory study features
True Experiments in Education • Slavin (2004) analyzed studies in AERJ. • Out of 112 articles, six (5.4%) reported experimental-control comparisons. • Only three (2.7%) were randomized studies of extended treatments. • Nave, Meich, and Mosteller (1999) • < 1% of the studies archived in ERIC Abstracts involved random assignment.
The Diamond Standard • The gold standard • true experiments, high in internal validity to maximize causal inference. • Did the independent variable, as manipulated, produce a change in the dependent variable, as measured. • The importance of external validity • To what populations, settings, and variables may the treatment be generalized?
The Diamond Standard • A carefully controlled true experiment in education may be conducted with short duration treatments, limited engagement of school staff, involve few students, teachers, and schools, and use measures that are external to school life. • The worst criticisms of these studies are that they are so low in external validity that they are irrelevant to educators. If so, the findings from well-controlled studies may not be replicable in “real world” testing. • Failures to generalize may have serious consequences if treatments do not work, or worse, have negative impacts under certain conditions.
The Paradoxes • How do we conduct a review when the number of high quality studies is low? • How do we insure that review conclusions are applicable to classrooms? • How do we learn from all the evidence or should we limit our analyses to a small subset?
Four Ways to Deal with Study Quality • Inclusion of only the highest quality studies (e.g., RCTs)—An absolute judgment. • Classify studies of different quality and analyze separately • Weight studies by methodological quality • Treat methodological quality as a predictor of effect size to determine and remove its influence (Analyze the bestavailable evidence). A relative judgment.
The fundamental choice • Use study quality as an inclusion/exclusion criterion. • Use study quality as a study feature and empirically test it’s effects. • SQ as study feature gives the reviewer more choices including whether and how to treat subsets of the data.
Judging Methodological Quality • No matter what method one uses to deal with study quality, the problem of judgment, rating or categorization of quality remains. • One may make errors in selecting only RCTs for analysis. • And one may make errors in classifying studies as high, medium and low in quality.
The Four Steps • Step one: Are the effect sizes homogeneous? If not, make no adjustment. Stop. • Step two: Does study quality explain the heterogeneity? If not, make no adjustment. Stop. • Step three: Which qualities of studies matter? Find where the differences are. • Step four: How do we deal with the differences? Adjust towards the best studies.
Study Quality (SQ) as a Predictor of Effect Size Treat Categories of SQ as Dummy Codes Treat SQ as a Quasi-Continuous Predictor
Step one: Are the effect sizes homogeneous? • Weighed multiple regression (I.e., inverse variance weights) is performed. QTotal is derived from the ANOVA table and tested using 2 with p – 1 df (Table 2)
Table 2 Conclusion:The effect sizes (QTotal) are heterogeneous
Step two: Does study quality explain the heterogeneity? • The QBetween (in Table 2) tells us that, as a set, the dummy coded levels of SQ are a significant predictor of effect size • QWithin is homogeneous (Table 2) • Now, we can examine the weighted means for each category of SQ (Table 3) and continue to the next step
Step three: Which qualities of studies matter? • Perform post hoc analysis (e.g., paired Bonferroni tests)
Conclusion:Categories 1 and 2 are nsd and categories 3, 4 and 5 are nsd. The two subsets are significantly different. Table 4
Step four: How do we deal with the differences? • Adjust Categories 3, 4 and 5 to the mean of Categories 1 and 2 (see Table 5)
Table 5 Conclusion:Group means are adjusted but within-group variability remains unaffected. The entire set of mean effect sizes are now homogeneous
Dummy coding vs. Regular Regression Adjusting the mean differences among the poor quality studies to match those of high quality studies is not the same as removing the effect of study quality in a traditional regression approach. In regression, subgroup means of both high quality and low quality studies would be adjusted towards the overall or grand mean. If applied to the current example, the traditional adjustment would result in increasing the subgroup means of the high quality studies. Studies lower in quality would, therefore, erroneously influence the estimate of overall mean effect size. This is an undesirable outcome.
Bernard,R.M., Abrami,P.C., Borokhovski , E., Wade, A., Tamim, R., Surkes, M. & Bethel, E. (2008). A Meta-Analysis of Three Types of Interaction Treatments in Distance Education. Review of Educational Research, in press.
Power Considerations in Study Features Analysis • Need to check if SQ analysis has adequate power. • See Piggott & Hedges for method. • If power is low, may need to adjust ES means without significance test.
Overall Conclusion • Provides flexibility in exploring the nature and extent of the relationship between methodological quality and effect sizes • Explores whether and to what extent methodological quality influences effect size outcomes • Gives the reviewer the opportunity to remove the influence of methodological quality from the collection of studies and then continue to analyze other study features in the entire collection of evidence
Thank you! abrami@education.concordia.ca