Poster Session Templates
Poster Session Templates. Instructions. Creating posters to showcase your research


Poster Session Templates
E N D
Presentation Transcript
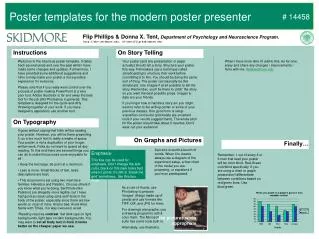
Instructions Creating posters to showcase your research We have created a series of PowerPoint templates to help you build an illustrative and educational poster to showcase your research and work. These templates include options of design styles and column layouts that you can use to best suit your needs. You can mix and match various elements from these templates in any way you choose to present your data and charts. These templates are intended to make your process easier and to establish a consistent background for CI Days posters. However, feel free to use graphical elements other than the ones you find here. If you are presenting a CI Days grant project, we request that you include the CRC logo on your poster. How to use this file Templates in this document are set to 2 feet by 1.5 feet, which is half the size of a finished poster. Your file will produce a printed poster that is 4 feet by 3 feet. If you use bitmapped images, such as TIFF or JPEG, make sure you attach high-resolution images (preferably 400-600 pixels per inch) to ensure the best print quality. Vector images, including EPS files, scale without loss of quality. To see the actual size of your printed poster, set your Zoom to 200%. Use standard PowerPoint tools to drop digital assets into slides, size/align them to fit, and arrange elements to create your presentation. After you have completed your layout, delete all ancillary slides, and send your PowerPoint file to: Kristina Davis, kristina.davis@nd.edu We must receive your file no later than April 19, 2010. We will print your poster and convert your file to PDF for publication on the CI Days Web site. Sample posters We have included sample layouts at the end of this document. They illustrate various ways you can create your poster using these templates.
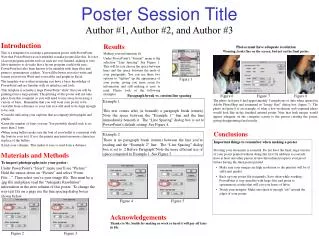
Title Researcher / Presenter Name Institution / Organization / Company Name Heading Heading Place Graphic Here Body Text Body Text Heading Heading Body Text Body Text Place Graphic Here Heading 1. Journal Article, Name of Journal 2. Journal Article, Name of Journal 3. Journal Article, Name of Journal
Title Title Researcher / Presenter Name Institution / Organization / Company Name Researcher / Presenter Name Institution / Organization / Company Name Heading Heading Heading Heading Body Text Body Text Body Text Body Text Place Graphic Here Place Graphic Here Heading 1. Journal Article, Name of Journal 2. Journal Article, Name of Journal 3. Journal Article, Name of Journal Place Graphic Here Place Graphic Here
Title Researcher / Presenter Name Institution / Organization / Company Name Heading Heading Heading Heading Body Text Body Text Body Text Body Text Heading Body Text Heading 1. Journal Article, Name of Journal 2. Journal Article, Name of Journal 3. Journal Article, Name of Journal
Title Researcher / Presenter Name Institution / Organization / Company Name Heading Heading Heading Body Text Body Text Body Text Place Graphic Here Heading Body Text Place Graphic Here Heading 1. Journal Article, Name of Journal 2. Journal Article, Name of Journal 3. Journal Article, Name of Journal
Visualizing Biomolecular Structure and Dynamics Kristina E. Furse and Steven A. Corcelli Department of Chemistry and Biochemistry, University of Notre Dame, IN 46556 portraying movement Visualization is a tremendously important tool for understanding the relationships between structure, dynamics and function in biological systems. It is especially crucial for data intensive computational studies, where good visualization can highlight important relationships hiding in pages of numbers. Challenges include accurately representing complex three dimensional objects in two dimensions, conveying movement, and compressing massive amounts of data into a small visual space in order to facilitate comparisons. Conveying molecular dynamics on paper introduces another significant challenge: adding a fourth dimension, time. Here again, transparency is an incredibly useful tool. Movement can be conveyed by layering multiple transparent structures. Movement of water in the minor groove of DNA is indicated by layering snapshots of future water positions after 20, 40, 60 and 80 ps, with transparency increasing proportional to time. Different representations of a double-stranded DNA dodecamer highlighting sequence, base pairing, structure, volume, and interaction with a minor-groove binding drug .1 Molecules rendered with UCSF Chimera.2 data compression structure and volume The structure of a biological molecule is closely related to its function, so simply looking at structures can yield tremendous insight. A simple wireframe model with atoms connected by stick bonds is sufficient for 3D viewing on a stereo monitor, but quickly collapses into a haystack in 2D. Simplifications like “cartoon” ribbon representation and molecular surfaces, together with strategic use of color, clipping planes and transparency can help recapture 3D structure and volume in 2D. Beyond structure, effective visualization is needed to analyze a wide variety of data extracted from molecular dynamics simulations. Compressing large amounts of data into a small visual space can emphasize relationships and trends in a clear and powerful way. Structure of p58C protein, which contains an iron-sulfur cluster coordinated by four cystine residues. Reducing the 2D data to a single number, the slope of the average mean-squared displacement, facilitates broad comparisons. Water movement in three solvation zones can be visualized for native DNA (above), as well as DNA with a fluorescent probe in place of a base pair to quantify perturbation of the solvent environment due to the probe (right). References 1. K. E. Furse and S. A. Corcelli JACS 2008, 130:13103. 2. E. F. Pettersen, et. al. J. Comp. Chem. 2004, 25:1605. 3. C. S. Miller, E. A. Ploetz, M. E. Cremeens and S. A. Corcelli. J. Chem. Phys. 2009, 130:125103. Acknowledgements S. A. Corcelli • C. S. Miller • W. J. Chazin • NWICG • CRC • NSF
Title Visualizing Biomolecular Structure and Dynamics Kristina E. Furse and Steven A. Corcelli Department of Chemistry and Biochemistry, University of Notre Dame, IN 46556 portraying movement Visualization is a tremendously important tool for understanding the relationships between structure, dynamics and function in biological systems. It is especially crucial for data intensive computational studies, where good visualization can highlight important relationships hiding in pages of numbers. Challenges include accurately representing complex three dimensional objects in two dimensions, conveying movement, and compressing massive amounts of data into a small visual space in order to facilitate comparisons. Conveying molecular dynamics on paper introduces another significant challenge: adding a fourth dimension, time. Here again, transparency is an incredibly useful tool. Movement can be conveyed by layering multiple transparent structures. data compression Beyond structure, effective visualization is needed to analyze a wide variety of data extracted from molecular dynamics simulations. Compressing large amounts of data into a small visual space can emphasize relationships and trends in a clear and powerful way. Above, movement of water in the minor groove of DNA is indicated by layering snapshots of future water positions after 20, 40, 60 and 80 picoseconds, with transparency increasing proportional to time. Reducing the 2D data (top) to a single number, the slope of the average mean-squared displacement, facilitates broad comparisons. Water movement in three solvation zones can be visualized for native DNA (above), as well as DNA with a fluorescent probe in place of a base pair to quantify probe perturbation (right). structure and volume The structure of a biological molecule is closely related to its function, so simply looking at structures can yield tremendous insight. A simple wireframe model with atoms connected by stick bonds is sufficient for 3D viewing on a stereo monitor, but quickly collapses into a haystack in 2D. Simplifications like “cartoon” ribbon representation and molecular surfaces, together with strategic use of color, clipping planes and transparency can help recapture 3D structure and volume in 2D. Above, multiple different atomic representations are used together to describe the structure of DNA and its first solvation shell. Red spheres are used to represent water molecules which form a “spine of hydration” along the unusually narrow minor groove of A-tract DNA. Below, a similar approach is used to show the structure of p58C protein, which contains an iron-sulfur cluster coordinated by four cystine residues. Ribbons clarify alpha-helical secondary structure, while the transparent surface shows the overall shape and volume. References 1. K. E. Furse and S. A. Corcelli JACS 2008, 130:13103. 2. E. F. Pettersen, et. al. J. Comp. Chem. 2004, 25:1605. 3. C. S. Miller, E. A. Ploetz, M. E. Cremeens and S. A. Corcelli. J. Chem. Phys. 2009, 130:125103. Acknowledgements S. A. Corcelli • C. S. Miller • W. J. Chazin • NWICG • CRC • NSF Different representations of the same double-stranded DNA dodecamer, highlighting sequence, base pairing, structure, volume, and interaction with a minor-groove binding drug .1 Molecules rendered with UCSF Chimera.2 Here, transparent layering indicates the relationship between bond vibration and conformation in alanine dipeptide with an alpha-carbon deuterium probe.