Download
1 / 1
10 likes | 109 Vues
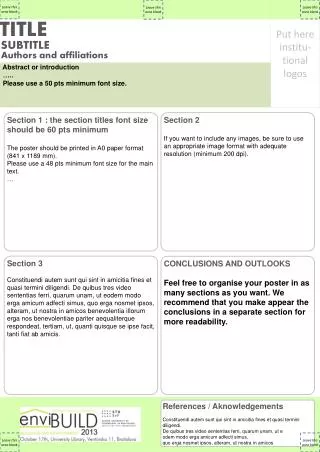
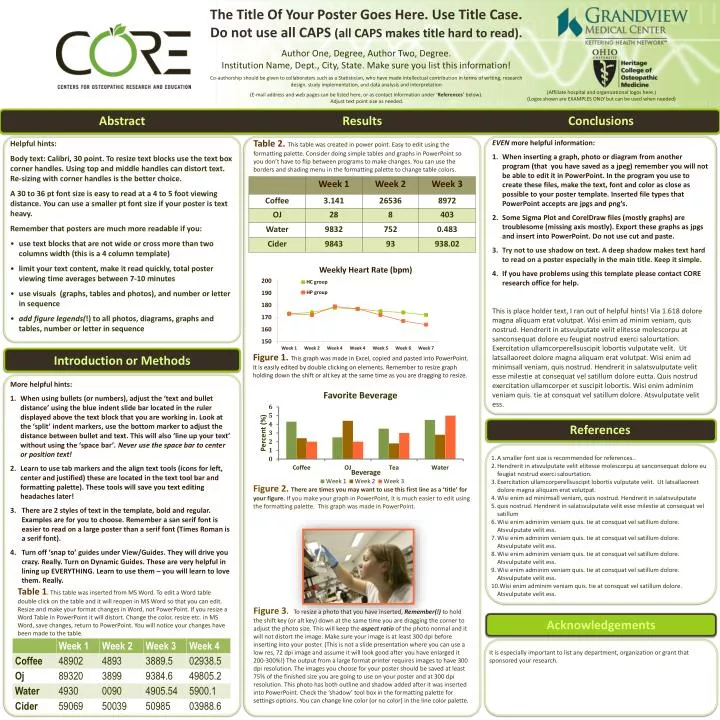
The Title Of Your Poster Goes Here. Use Title Case. Do not use all CAPS (all CAPS makes title hard to read). Author One, Degree, Author Two, Degree. Institution Name, Dept., City, State. Make sure you list this information!

E N D
The Title Of Your Poster Goes Here. Use Title Case.Do not use all CAPS (all CAPS makes title hard to read). Author One, Degree, Author Two, Degree.Institution Name, Dept., City, State. Make sure you list this information! Co-authorship should be given to collaborators such as a Statistician, who have made intellectual contribution in terms of writing, research design, study implementation, and data analysis and interpretation (E-mail address and web pages can be listed here, or as contact information under ‘References’ below). Adjust text point size as needed. (Affiliate hospital and organizational logos here.) (Logos shown are EXAMPLES ONLY but can be used when needed) Abstract Results Conclusions Table 2. This table was created in power point. Easy to edit using the formatting palette. Consider doing simple tables and graphs in PowerPoint so you don’t have to flip between programs to make changes. You can use the borders and shading menu in the formatting palette to change table colors. EVEN more helpful information: When inserting a graph, photo or diagram from another program (that you have saved as a jpeg) remember you will not be able to edit it in PowerPoint. In the program you use to create these files, make the text, font and color as close as possible to your poster template. Inserted file types that PowerPoint accepts are jpgs and png’s. Some Sigma Plot and CorelDraw files (mostly graphs) are troublesome (missing axis mostly). Export these graphs as jpgs and insert into PowerPoint. Do not use cut and paste. Try not to use shadow on text. A deep shadow makes text hard to read on a poster especially in the main title. Keep it simple. If you have problems using this template please contact CORE research office for help. This is place holder text, I ran out of helpful hints! Via 1.618 dolore magna aliquam erat volutpat. Wisi enim ad minim veniam, quis nostrud. Hendrerit in atsvulputate velit elitesse molescorpu at sanconsequat dolore eu feugiat nostrud exerci salourtation. Exercitation ullamcorperellsuscipit lobortis vulputate velit. Ut latsallaoreet dolore magna aliquam erat volutpat. Wisi enim ad minimsall veniam, quis nostrud. Hendrerit in salatsvulputate velit esse milestie at consequat vel satillum dolore eutta. Quis nostrud exercitation ullamcorper et suscipit lobortis. Wisi enim adminim veniam quis. tie at consquat vel satillum dolore. Atsvulputate velit ess. • Helpful hints: • Body text: Calibri, 30 point. To resize text blocks use the text box corner handles. Using top and middle handles can distort text.Re-sizing with corner handles is the better choice. • A 30 to 36 pt font size is easy to read at a 4 to 5 foot viewing distance. You can use a smaller pt font size if your poster is text heavy. • Remember that posters are much more readable if you: • use text blocks that are not wide or cross more than two columns width (this is a 4 column template) • limit your text content, make it read quickly, total poster viewing time averages between 7-10 minutes • use visuals (graphs, tables and photos), and number or letter in sequence • add figure legends(!) to all photos, diagrams, graphs and tables, number or letter in sequence Figure 1. This graph was made in Excel, copied and pasted into PowerPoint. It is easily edited by double clicking on elements. Remember to resize graph holding down the shift or alt key at the same time as you are dragging to resize. Introduction or Methods More helpful hints: When using bullets (or numbers), adjust the ‘text and bullet distance’ using the blue indent slide bar located in the ruler displayed above the text block that you are working in. Look at the ‘split’ indent markers, use the bottom marker to adjust the distance between bullet and text. This will also ‘line up your text’ without using the ‘space bar’. Never use the space bar to center or position text! Learn to use tab markers and the align text tools (icons for left, center and justified) these are located in the text tool bar and formatting palette). These tools will save you text editing headaches later! There are 2 styles of text in the template, bold and regular. Examples are for you to choose. Remember a san serif font is easier to read on a large poster than a serif font (Times Roman is a serif font). Turn off ‘snap to’ guides under View/Guides. They will drive you crazy. Really. Turn on Dynamic Guides. These are very helpful in lining up EVERYTHING. Learn to use them – you will learn to love them. Really. References A smaller font size is recommended for references.. Hendrerit in atsvulputate velit elitesse molescorpu at sanconsequat dolore eu feugiat nostrud exerci salourtation. Exercitation ullamcorperellsuscipit lobortis vulputate velit. Ut latsallaoreet dolore magna aliquam erat volutpat. Wisi enim ad minimsall veniam, quis nostrud. Hendrerit in salatsvulputate quis nostrud. Hendrerit in salatsvulputate velit esse milestie at consequat vel satillum Wisi enim adminim veniam quis. tie at consquat vel satillum dolore. Atsvulputate velit ess. Wisi enim adminim veniam quis. tie at consquat vel satillum dolore. Atsvulputate velit ess. Wisi enim adminim veniam quis. tie at consquat vel satillum dolore. Atsvulputate velit ess. Wisi enim adminim veniam quis. tie at consquat vel satillum dolore. Atsvulputate velit ess. Wisi enim adminim veniam quis. tie at consquat vel satillum dolore. Atsvulputate velit ess. Figure 2. There are times you may want to use this first line as a ‘title’ for your figure. If you make your graph in PowerPoint, it is much easier to edit using the formatting palette. This graph was made in PowerPoint. Table 1. This table was inserted from MS Word. To edit a Word table double click on the table and it will reopen in MS Word so that you can edit. Resize and make your format changes in Word, not PowerPoint. If you resize a Word Table in PowerPoint it will distort. Change the color, resize etc. in MS Word, save changes, return to PowerPoint. You will notice your changes have been made to the table. Figure 3. To resize a photo that you have inserted, Remember(!)to hold the shift key (or alt key) down at the same time you are dragging the corner to adjust the photo size. This will keep the aspect ratioof the photo normal and it will not distort the image. Make sure your image is at least 300 dpi before inserting into your poster. (This is not a slide presentation where you can use a low res, 72 dpi image and assume it will look good after you have enlarged it 200-300%!) The output from a large format printer requires images to have 300 dpi resolution. The images you choose for your poster should be saved at least 75% of the finished size you are going to use on your poster and at 300 dpi resolution. This photo has both outline and shadow added after it was inserted into PowerPoint. Check the ‘shadow’ tool box in the formatting palette for settings options. You can change line color (or no color) in the line color palette. Acknowledgements It is especially important to list any department, organization or grant that sponsored your research.


![[Four Logos Here]](https://cdn1.slideserve.com/2626780/slide1-dt.jpg)