Aircraft Performance
Aircraft Performance. Flying Further Than Any Other Aircraft in History. 26,389.3 miles. Written for the Notre Dame Pilot Initiative By the Pilots of the University of Notre Dame. Roadmap. POH Density Altitude Takeoff Distance Cruise Performance, Power & Fuel Burn Landing Distance

Aircraft Performance
E N D
Presentation Transcript
Aircraft Performance Flying Further Than Any Other Aircraft in History 26,389.3 miles Written for the Notre Dame Pilot Initiative By the Pilots of the University of Notre Dame “Teaching the Science, Inspiring the Art, Producing Aviation Candidates!”
Roadmap • POH • Density Altitude • Takeoff Distance • Cruise Performance, Power & Fuel Burn • Landing Distance • Crosswinds
Pilot’s Operating Handbook (POH) • Also known as Approved Flight Manual (AFM) • Organized into Sections • General • Limitations • Emergency Procedures • Normal Procedures • Performance • Weight & Balance • Airplane & Systems Description • Handling, Service, & Maintenance • Supplements
Frequent Terms • Maximum Takeoff Weight (MTOW) • Maximum gross weight at which the airplane is permitted to takeoff • Maneuvering Speed • Maximum speed for maneuvers at which full application of the primary flight controls cannot overstress the airframe
Maneuvering Speed VA = 113 kts
Density Altitude Revisited • Density Altitude is pressure altitude corrected for nonstandard temperature • Varies directly with temperature and humidity • Varies indirectly with pressure • It is a number which tells you what the airplane (wings and engine) feels
Takeoff Distance • Two Varieties • Ground Roll • Distance to Clear 50 ft obstacle • Also known as Takeoff Distance • Distance for aircraft to clear a 50-foot obstacle after a standing start at maximum takeoff power • Factors • ↑ Weight = ↑ Distance (and speed) • ↑ Air Density = ↓ Distance • ↑ Headwind = ↓ Distance • ↑ Slope = ↑ Ground Roll • ↑ Flaps = ↓ Ground Roll • ↑ Friction = ↑ Ground Roll
Cessna 172R Takeoff Distance
Climb Performance • Vx=Best Angle of Climb • Gain maximum altitude in shortest distance • VY=Best Rate of Climb • Gain maximum altitude in shortest time • Cruise Climb
Cessna 172R Climb Performance
Cruise Flight • An airplane is more efficient at altitude • Wings • Engines • Weather is generally confined to the troposphere so you can fly over it • Higher gives more options in case of emergencies • Reserves • Day VFR: 30 minutes at normal cruising speed • Night VFR: 45 minutes at normal cruising speed
Cessna 172R Cruise Performance
Cessna 172R Cruise Performance
Performance Cruise VG = VL/D = 65 kts
Economy Cruise VS = 55 kts
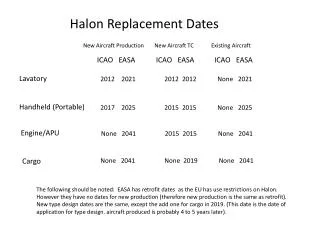
Landing Distances • Two Varieties • Ground Roll • Distance over a 50 foot obstacle • Also known as Takeoff Distance • Distance for aircraft to clear a 50-foot obstacle after a standing start at maximum takeoff power • Factors • ↑ Weight = ↑ Distance (and speed) • ↑ Air Density = ↓ Distance • ↑ Headwind = ↓ Distance • ↑ Slope = ↓ Ground Roll • ↑ Flaps = ↓ Distance • ↑ Friction = ↓ Ground Roll • Maximum performance landings are always accomplished with full flaps • Stiff crosswinds sometimes dictate the use of partial flaps
Cessna 172R Landing Distance
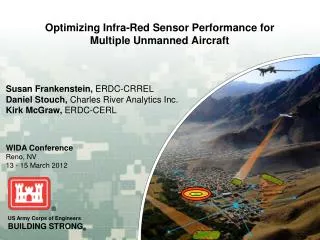
Boeing 727 Landing Distance
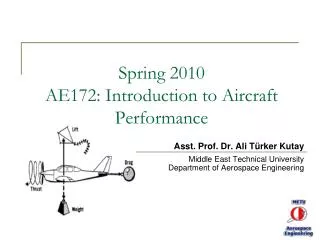
Crosswinds • Maximum Demonstrated Crosswind Component is the maximum crosswind that existed during FAA certification • Often is not close to real maximum capability of aircraft • Weak link is generally lack of rudder authority (not enough deflection) • Often VX-Wind = 0.3 VS0
Crosswind Chart 30 knot wind, 30 deg off of the nose = 26 knot headwind = 15 knot crosswind