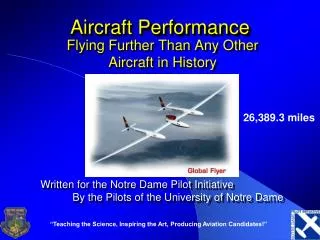
Aircraft Performance
Aircraft Performance. This does not supercede ANY official document. Graph Method. With a CG of 36 inches and a weight of 2200 pounds, the CG is in limits. 34” and 2400 pounds won’t work. OAT: 19 C Pressure Alt: 7,000 Density Alt: Approx. 8,800.

Aircraft Performance
E N D
Presentation Transcript
Aircraft Performance This does not supercede ANY official document.
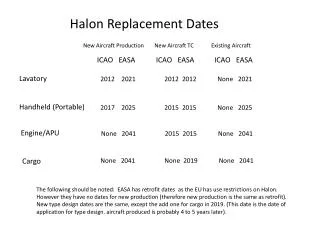
Graph Method With a CG of 36 inches and a weight of 2200 pounds, the CG is in limits 34” and 2400 pounds won’t work
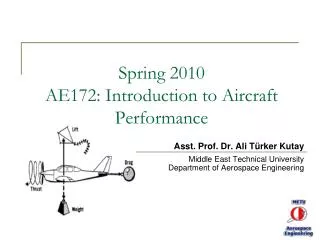
OAT: 19 C Pressure Alt: 7,000 Density Alt: Approx. 8,800 This is a simple chart to understand. First, locate the temperature at the bottom of the graph. Next, find the pressure alt. (the slanted line), 7000 in this case. Draw a line up form the temp., and then another along the pressure altitude gradient.
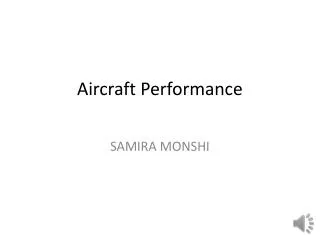
A BETTER EXAMPLE For the TBM 700 http://www.socataaircraft.com/homepage/english/menu_indexenglish.htm