Download

1 / 20
200 likes | 323 Vues
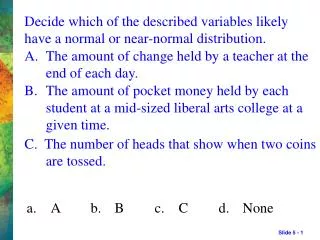
A new test statistic. introducing Χ 2 Inference for Distribution of Categorical Variables. Three Tests. 1. 3. 2. Goodness Of Fit. Association/ Independence. Homogeneity Of Populations. Conditions?. 1. Goodness of Fit Are the hypothesized proportions true?.

E N D
A new test statistic introducingΧ2 Inference for Distribution of Categorical Variables
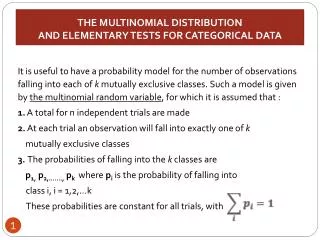
ThreeTests 1 3 2 Goodness Of Fit Association/ Independence Homogeneity Of Populations Conditions?
1 Goodness of Fit Are the hypothesized proportions true? Proportion of Colors in a bag of M&M’s
Tech Toolbox pp. 843 and 863 All individual EXPECTED counts at least 1 and no more than 20% are less than 5. Some books say each cell must have at least 5 expected counts. Ho: the actual population proportions are equal to the hypothesized proportions Ha: at least two of the actual population proportions differ from their hypothesized proportions
Put data into lists as described on page 843 What is the largest component affecting our X2 statistic? Remember that Ho: pred = .13 pbrown = .13 pyellow = .14 pgreen = .16 porange = .20 pblue = .24 Let’s try our m&m data Look at 14.2 on page 846…let’s do some inference.
For Goodness of Fit – Single categorical variable that takes values on a single population. Should Marijuana be legalized for medical purposes? Activity 14B p. 849 For Test of Homogeneity – Either two categorical variables taking values on a single population Or A single categorical variable taking values on two or more populations. • Explain what a two-waytable is. • Compute row or column conditional distributions. • Identify the null hypothesis for a X2 test for homogeneity of populations.
2 Test for Homogeneity Our example What type of 2 way table do we have?
Ho: The distribution of the response variable is the same in all c populations. What is the null hypothesis?
Expected Cell counts Let’s find our expected cell counts. Remember, the alternative hypothesis is that the response variable distribution is not the same over the explanatory variables.
Any questions still for Homogeneity of Proportions? Remember – Just because we find a X2 statistic that is significant and reject our null; we only know that not all of the population proportions were equal!
Other ways to state hypotheses Ho: the two categorical variables are not related. Ha: the two categorical variables are related. Ho: the two categorical variables are independent. Ha: the two categorical variables are not independent (or, are dependent).
Remember: Homogeneity: data must come from a comparative randomized experiment or from independent random samples from the populations of interest. Association/Independence: data should be obtained by classifying a single sample according to both categorical variables. Heath Care: Canada vs. USLife after being treated for a heart attack Let’s find the conditional distributions of the quality of life given the country where treated.
What are our hypotheses? Ho: There is no relationship between nationality and quality of life.Ha: There is some relationship between nationality and quality of life.
? Conditions? Expected Counts large enough – let’s calculate! SRS the data came from independent random samples from the two populations (US and Canada, eh?)
Medical Care and Age • The type of medical care that a patient receives sometimes varies with the age of the patient. • Here are data from a study that asked whether women received a mammogram and biopsy after noticing a suspicious lump in their breast. • In this study, a single sample was classified two ways: by age and by whether or not the tests were done.
Now you can work on: ExercisesSpecial ProblemCase Closed We can also watch a video on Inference for Two Way Tables
Spread the Message! For a media-rich presentation, you can Optimize for Compatibility orCompress Media to share your presentation reliably without exploding your inbox Package your presentation for easy sharing
? But wait…There’s More! View your slides from anywhere!
AccessAnywhere • Check out the • PowerPoint Web App • Access slides wherever you are
POWERPOINT 2010 What’s Your Message?