Download
1 / 29
700 likes | 2.6k Vues
Cardiac Output, Venous Return and Their Regulation. The Cardiac Cycle. SYSTOLE. AV opens. AV closes. 120. Aortic Pressure (mmHg). 80. Left Ventricular Pressure (mmHg). MV closes. MV opens. Left Atrial Pressure (mmHg). 0. 120. Left Ventricular Volume (ml). 0.

E N D
The Cardiac Cycle SYSTOLE AV opens AV closes 120 Aortic Pressure (mmHg) 80 Left Ventricular Pressure (mmHg) MV closes MV opens Left Atrial Pressure (mmHg) 0 120 Left Ventricular Volume (ml) 0 0 .2 Time (sec) http://www.hhmi.org/biointeractive/cardiovascular/heartfunction.mov
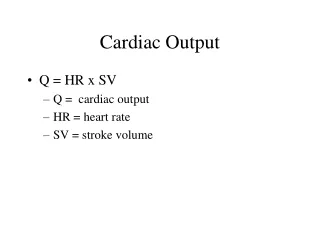
Cardiac Output (CO) • Amount ejected by ventricle in 1 minute • That is also quantity of blood that flows through the circulation • Cardiac Output = Heart Rate x Stroke Volume • about 4 to 6L/min at rest • vigorous exercise CO to 21 L/min for fit person and up to 35 L/min for world class athlete • Cardiac reserve: difference between a persons maximum and resting CO • with fitness, with disease
Heart Rate • Pulse = surge of pressure in artery • infants have HR of 120 bpm or more • young adult females avg. 72 - 80 bpm • young adult males avg. 64 to 72 bpm • HR rises again in the elderly • Tachycardia: resting adult HR above 100 • stress, anxiety, drugs, heart disease or body temp. • Bradycardia: resting adult HR < 60 • in sleep and endurance trained athletes
Normal Values for Cardiac Output • Cardiac output varies with the level of activity of the body: • Basic level of body metabolism • Whether the person is exercising • The person’s age and • Size of the body • For young healthy men, resting cardiac output averages about 5.6 lt/min • For women, 4.9 lt/min • CO for the resting adult is 5 lt / min (round numbers)
Cardiac Index • CI = Cardiac output / square meter of body surface area • 70 kg person is about 1.7 square meter • CI = 5 / 1.7 = 3 lt / m2 body surface area
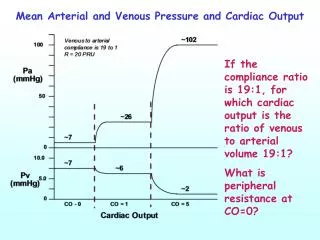
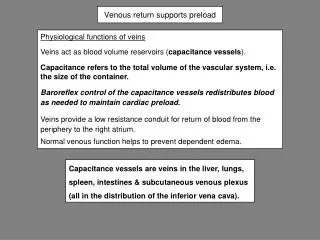
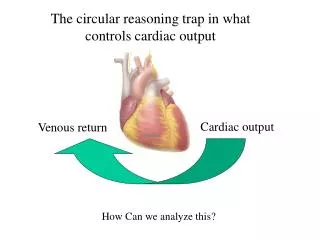
Venous Return • Venous return is the quantity of blood flowing from the veins into the right atrium each minute. • The venous return and cardiac output must equal each other except for a few heart beats at a time when blood is temporarily stored in or removed from the heart and lungs.
Control of Cardiac Output by Venous Return • Role of Frank-Starling mechanism of the heart • It is the various factors of the peripheral circulation that affect flow of blood into the heart from the veins, called venous return, that are the primary controllers • Stretch of the sinus node has a direct effect on rhythmycity of the node • Stretched right atrium initiates a nervous reflex called Bainbridge reflex passing to the vasomotor center and back to the heart • Under most normal unstressful conditions, cardiac output is controlled almost entirely by venous return
Lungs The Normal Heart and Regional Circulation Pulmonary Semilunar Valve Aorta Left Pulmonary Artery Superior Vena Cava Left Pulmonary Veins Left Atrium Right Pulmonary Artery Aortic Semilunar Valve Bicuspid or Mitral Valve Right Pulmonary Veins Tricuspid Valve Inferior Vena Cava Septum
Tissue Metabolism Regulates Most Local Blood Flow • In most tissues, blood flow increases in proportion to each tissue’s metabolism • At each increasing level of work output during exercise, the oxygen consumption and CO increase in parallel to each other
Effect of TPR on the Long-Term Cardiac Output Level Cardiac Output = Arterial Pressure / Total Peripheral Resistance
Cardiac Output Curves for normal, hyperactive and hypoactive hearts
Factors That Can Cause Hypereffective Heart • Nervous stimulation of the heart • Hypertrophy of the heart muscle Effect of nervous excitation to increase heart pumping • Sympathetic stimulation • Parasympathetic inhibition • Increases the heart rate (up to 180-200 beats/min) • Increases the strength of the heart contraction Increased pumping effectiveness caused by heart hypertrophy • Increased heart muscle in marathon runners (50 to 75 %) • i.e. CO can be increased as much as 30-40 lt/min
Factors That Cause a Hypoeffective Heart • Coronary artery blockage (causing heart attack) • Inhibition of nervous excitation of the heart • Abnormal heart rhthym or rate of heartbeat • Valvular heart disease • Increased arterial pressure (hypertension) • Congenital heart disease • Myocarditis • Cardiac hypoxia
Pathologically High and Low Cardiac Outputs • High cardiac output caused by reduced TPR • Beriberi • Arteriovenous fistula (AV shunt) • Hyperthyroidism • Anemia
Low Cardiac Output • Abnormalities that cause the pumping effectiveness of the heart to fall too low • Conditions that cause venous return to fall too low • Decreased Cardiac Output by Cardiac Factors • Severe coronary blood vessel blockage and MI • Severe valvular heart disease • Myocarditis • Cardiac tamponade • Cardiac metabolic derangements • When CO falls too low, the body tissues begin to suffer nutritional deficiency (this condition is called cardiac shock)
Low Cardiac Output • Decreased Cardiac Output by non-cardiac peripheral factors (Venous Return) • Decreased blood volume • Acute venous dilation (this results from sudden inactivation of sympathetic nervous system) • Obstruction of large veins • Decreased tissue mass (especially skeletal muscle), reduced oxygen consumption • Regardless of the cause (peripheral or cardiac) of low CO • If ever the CO falls below that level required for adequate nutrition of the tissues, the person is said to suffer “circulatory shock”
Cardiac Output Curves used in the quantitative analysis • Effect of external pressure outside the heart on cardiac output curves • The normal intrapleural pressure is about – 4 mmHg • Some factors can alter this pressure and thus CO • Cyclical changes of intrapleural pressure during respiration • Breathing against a negative pressure, which shifts the curve to a more negative right atrial pressure • Positive pressure breathing (more positive RAP) • Opening the thoracic cage • Cardiac tamponade
Venous Return Curves • Three factors that affect venous return to the heart from the systemic circulation • Right atrial pressure • Degree of filling of the systemic circulation (mean systemic filling pressure) • Resistance to blood flow between the peripheral vessels and the right atrium
Mean Systemic Filling Pressure • When the heart pumping is stopped by shocking the heart with electricity to cause ventricular fibrillation or is stopped in any other way, flow of blood everywhere in the circulation ceases a few seconds later. • Without blood flow, the pressures becomes equal everywhere in the circulation • This equlibrated pressure level is called Mean Circulatory Filling Pressure (MCFP) • The greater the volume of blood in the circulation, the greater is the MCFP. • Because extra blood stretches walls of the vessels
Analysis of Cardiac Output and Right Atrial Pressure • In the complete circulation, the heart and systemic circulation must operate together • Venous return must equal the cardiac output • RAP is the same for both heart and circulation
Further compensatory effects initiated in response to increased blood volume • 1) Increased CO increases the capillary pressure so that fluid begins to transude into the tissue • 2) Increased pressure in the veins causes the veins to continue distending gradually by the stress-relaxation mechanism • 3) The excess blood flow through the peripheral tissues causes autoregulatory increase in the peripheral resistance, thus increasing the resistance to venous return • These factors cause the mean systemic filling pressure to return back toward normal and the resistance vessels of the circulation to constrict • Over a period of 10 to 40 min, the CO returns almost to normal
Effect of sympathetic stimulation or inhibition on cardiac output • Sympathetic stimulation makes the heart a stronger pump • Increases the mean systemic filling pressure (contraction of vessels) • Sympathetic inhibition decreases MSFP to about 4 mmHg • Effectiveness of heart as a pump decreases to about 80% of normal