Demography and Life Expectancy
590 likes | 873 Vues
Demography and Life Expectancy. J. Hughes 2007. Definitions. Gerontology: the study of the aging process (biological, sociological, and historical). Geriatrics: the branch of medicine that deals with health care for the elderly. Demography: the statistical study of human populations.

Demography and Life Expectancy
E N D
Presentation Transcript
Demography and Life Expectancy J. Hughes 2007
Definitions • Gerontology: the study of the aging process (biological, sociological, and historical). • Geriatrics: the branch of medicine that deals with health care for the elderly. • Demography: the statistical study of human populations.
Fertility: Definitions • Crude birth rate: the annual number of live births per thousand people • General fertility rate: the annual number of live births per 1000 women of childbearing age (often taken to be from 15 to 49 years old, but sometimes from 15 to 44). • Age-specific fertility rate: the annual number of live births per 1000 women in particular age groups (usually age 15-19, 20-24 etc.) • Total fertility rate: the number of live births per woman completing her reproductive life if her childbearing at each age reflected current age-specific fertility rates
Fertility in every developed country has fallen beneath the 2.1 “replacement rate.” 2.1
Total Fertility Rates – Europe and North America 1950-2000 ____________________ Source: United Nations
Total Fertility Rates – Asian Countries 1950-2000 In chart minimum value in y axis is 0 and crosses at 0. 5 In PowerPoint a white fill box has been used to blank out the 0 ____________________ Source: United Nations
European Fertility Rates - 2001 ____________________ Source: GAD
Total Fertility Rates – Iran, Turkey, Brazil, 1950-2020 In chart minimum value in y axis is 0 and crosses at 0. 5 In PowerPoint a white fill box has been used to blank out the 0 1950 and 2020 are text boxes in PowerPoint with a white fill 1950 2020 -55 -65 -75 -85 -95 -05 -15 -25 ____________________ Source: United Nations
Mortality: Definitions • Crude death rate: the annual number of deaths per 1000 people • Infant mortality rate: the annual number of deaths of children less than 1 year old per thousand live births
Log mortality is linear Mortality increases exponentially!
Definition: Life expectancy • Life expectancy: the number of years which an individual at a given age can expect to live at present mortality rates • For example: • Mean lifespan of US females: 79 years. • Expected ls of US females 20 yrs old: 83 yrs. • Expected ls of US females 85 yrs old: 91 yrs • Expected ls of US females 90 yrs old: 94 yrs. • Life expectancy at birth = mean lifespan • At older ages life expectancy > mean lifespan • Mean Longevity: average longevity of a population. Sum of ages at death / # of individuals. • Maximum longevity: age at death of the longest-lived number of a population.
Life expectancy and infant mortality throughout human history Life expectancyInfant mortality rate at birth (years)(per 1000 live births) Prehistoric 20-35200-300 Sweden, 1750s 37 210 India, 1880s 25230 U. S., 1900 48133 France, 1950 6652 Japan, 1996 804
Human lifespan • Mean Longevity in the US: • Males, 75 yrs. • Females, 80 yrs. • Maximum longevity (verified): • Jeanne Clament who died in 1997 at age 122
Life spans in the developed countries have risen dramatically.
Demographic Transition • Increasing Longevity • Declining Fertility • Baby Boom Cohort • Stabilization
World’s 15 ‘Oldest’ Countries and the U.S. Percent Age 65 or Older Sources: Carl Haub, 2006 World Population Data Sheet.
Projected Population Change, by Country Percent Population Change, 2005-2050 Source: Population Reference Bureau, 2005 World Population Data Sheet.
Life Expectancy at Birth(1) – Male – World & UK ____________________ Source: GAD for UK; United Nations for World Note: These are “Period” Life expectations, which actually underestimate the expected life span of a baby born in the year specified, but which are easier to calculate than the correct “cohort” figures and therefore frequently used in international comparisons. See footnote x in lecture text for explanation
Life Expectancy at 60(1) – Male – UK & France ____________________ Source: Eurostat demographic year book; GAD for UK Note: On “Period” basis
UN Life Expectancy Projections to 2050 Life Expectancy at Birth, in Years Source: United Nations, World Population Prospects: The 2004 Revision (medium scenario), 2005.
100 2002 1950 80 1900 60 Percent Surviving 40 20 0 0 10 20 30 40 50 60 70 80 90 100 Age Survival Curves for U.S. Population, 1900 to 2002 Source: Arias E. United States Life Tables, 2002. National Vital Statistics Reports; vol. 53, no. 6. Hyattsville, MD: National Center for Health Statistics, 2004.
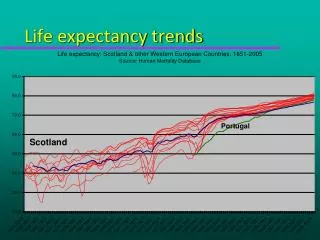
82 80 78 76 74 72 70 68 66 64 1965 1970 1975 1980 1985 1990 1995 2000 Trend in life expectancy (both sexes) since 1965 in industrialised countries Life expectancy at birth Source: France: Vallin And Meslé 2001; Russia: Meslé et al. 1998; Ukraine: Meslé amd Vallin, in press; other coutnries: various statistical and demographic yearbooks. This chart is in Demographic Research – Special Collection 2: Article 2 , Convergences and divergences in mortality. A new approach to health transition, by Jacques Vallin and France Meslé, April 16, 2004
Increase in Average Life Expectancy in Years in Some Countries, 1950-1995 Developed Countries Developing Countries Japan 15 China 30 Italy 11 Turkey 24 France 10 India 22 United Kingdom 7 Egypt 19 USA 7 Kenya 18 Sweden 6.1 Brazil 15 Argentina 9
MALE LIFE EXPECTANCY AT 65 COUNTRY 1962 2002 Increase Netherlands 1.71 13.93 15.64 Denmark 1.86 13.51 15.37 Norway 2.03 14.18 16.21 Sweden 3.18 13.7 16.88 Belgium 3.4 12.46 15.86 Canada 3.53 13.64 17.17 US 3.64 12.92 16.56 Italy 4.02 12.9 16.92 New Zealand 4.18 12.71 16.89 Austria 4.26 11.99 16.25 UK 4.41 11.85 16.26 France 4.52 12.54 17.06 Finland 4.61 11.16 15.77 Switzerland 4.72 12.77 17.49 Australia 5.14 12.44 17.58 Japan 6.43 11.55 17.98 Average 3.85 12.77 16.62 Male Life Expectancy at 65 Developed Countries Data is from the Human Mortality Database. University of California, Berkeley (USA), and Max Planck Institute for Demographic Research (Germany). Available at www.mortality.org (data downloaded on February 2007).
Female Life Expectancy at 65 Developed Countries Data is from the Human Mortality Database. University of California, Berkeley (USA), and Max Planck Institute for Demographic Research (Germany). Available at www.mortality.org (data downloaded on February 2007).
30 26.6 25 20 15.2 Men 15 Percent Women 9.6 10 5.0 3.8 5 2.7 0 1900 1950 2002 Source: Computed from U.S. life tables in: Arias E. United States life tables, 2002. National vital statistics reports; vol. 53, no. 6. Hyattsville, MD: National Center for health Statistics, 2004. Probability of 50 year old living to 90, 1900 to 2002, by Gender
Probable causes for longevity in favor of women: • Genetic (XX vs. XY) or Environmental (geography, country, income) • Other causes: Lesser life stress in females Less smoking Protective action of estrogens? Lesser accumulation of mDNA deletions/mutations with better protection against oxidative damage Others? Implication for prevention and treatment
From Pop Pyramids to Pop Columns B B A A Age Group 100 + 95 - 99 90 - 94 85 - 89 80 - 84 75 - 79 70 - 74 65 - 69 60 - 64 55 - 59 50 - 54 45 - 49 40 - 44 35 - 39 30 - 34 25 - 29 20 - 24 15 - 19 10 - 14 5 - 9 0 - 4
Age Band 80-100 60-80 40-60 20-40 0-20 1970 2000 2050 Italy’s Population Structure 1970-2050 Millions ____________________ Source: U.N. Medium variant for 2050 projection
Dependency Ratio Forecasts 2000-2050 Ratio of 20-64 Year Olds to 65+ ____________________ Source: UN Medium Variant
60+ 15-59 0-15 Years Demographic Change in UK and China – UN Medium Variant % Population by Age Band 2000 2050 UK China ____________________ Source: OECD Historical Statistics: OECD Economic Outlook
Dependency Ratio Dynamics under Different Demographic Challenges
Key Choices • Accept the deterioration of dependency ratios • Poorer pensioners • Higher taxes • Higher savings • Offset the deterioration of dependency ratios • Immigration • Higher birth rate • Later retirement ages • Healthy longevity (Longevity Dividend)