Download

1 / 30
300 likes | 492 Vues
Overall design. Presented by. Eva Elvers Statistics Sweden. Outline. What is a survey? statistics? The GSBPM Quality – some perspectives Design of a statistical survey – some aspects . What is a survey? From EHQR 2009. Sample survey Census

E N D
Presented by • Eva Elvers • Statistics Sweden
Outline • What is • a survey? • statistics? • The GSBPM • Quality – some perspectives • Design of a statistical survey – some aspects
What is a survey? From EHQR 2009 • Sample survey • Census • Statistical process using administrative source(s) • Statistical process involving multiple data sources • Price or other economic index process • Statistical compilation
What is statistics? A statistical table • A statistical measure (e.g. sum, mean or median) is used to summarise • individual variable values (e.g. turnover) for • the statistical units (e.g. enterprise) in a group. • The totality of considered statistical units is called the population. • There are sub-populations; domains of estimation. • There are reference times for variables, units …
Typical for statistics (1) • Statistical characteristics or parameters as above. • Parameters of interest, depending on use and user. • Target parameters based on target variables, target units, target population, … • Statistics are estimates aiming at the target parameters.
Typical for statistics (2) • Variables of interest, target variables • Observationvariables • Consider • measurements; • quality; • costs; • sources; • response burden.
Typical for statistics (3) • Population and subpopulations • Several unit types may be needed • enterprise, kind of activity unit, local unit, … • interest, target, observation • A frame leading to a frame population • Compare with target population (unit type) • Coverage deficiencies • Time aspects
Typical for statistics (4) • Consider sources for data collection • direct data collection • accessible from earlier collection • administrative data • Express statistical inference • finite population • sample, register
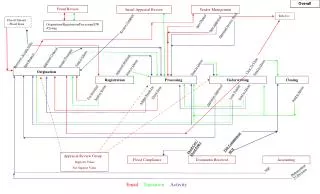
The GSBPM–Generic Statistical Business Process Model – the UNECE version in 2009, phases and sub-processes
Phases of the statistics production process • Phases 1 – 3, preparatory • Specify needs • Design • Build • Phases 4 – 8 • Collect, Process, Analyse, Disseminate, Archive • Phase 9 • Evaluate
Quality Assurance and Quality Control • Q is fitness for use, fitness for purpose, ... • QA: • Approaches and methods to achieve the intended/stated quality. • Providing confidence that the quality requirements will be met. • QC: • Verification that the quality achieved was as expected. • Checks, ...
Typical in a statistical office • Business register • Basis, frame construction, auxiliary information • Primary statistics • Short-term statistics (monthly, quarterly), STS • Structural statistics (annual), SBS • Secondary statistics • National accounts, Balance of payment etc.
Output quality components European Statistics CoP 2011, EHQR 2009 • Relevance • Accuracy and reliability • Timeliness and punctuality • Coherence and comparability • Accessibility and clarity
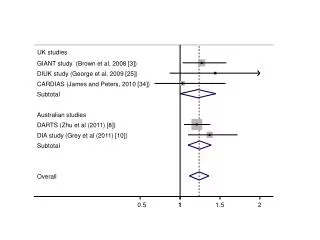
Accuracy and reliability (e.g. SIMS 2013) • Sources of error (in-accuracy) • Sampling • Coverage • Measurement • Non-response • Processing • Model assumption • Data revision (reliability) • Data revision, average size
Coherence and comparability • Meaning • Adequacy of being combined, used together • Important • Definitions: concepts, units, populations, … • Methods • Examples • Across domains, with National Accounts, … • Comparability special case, e.g. EU geographical • Over time
Relevance • User needs • Content: concepts, … • Quality components • User satisfaction • Completeness • Data (statistics) and metadata • Regulations • The system of surveys
Design aspects • Survey situation • Design a new survey • Redesign a survey • Continuous improvements • Scope • Methodological, technical, … • Set of surveys, survey, sub-process, tool, system, …
Design aim: ”optimisation” • There may be a simple statement, like • Minimum cost given quality. • Maximum quality given cost (quality is multi-facetted). • Design, two core tasks are to make “optimal” • choices, e.g. of methods; • allocations, e.g. of resources.
Which principles do you use to design • the frame? • the sample? • the data collection method? • the contact strategy? • the editing? • the estimation?
What do you need to design • What is the input?(groups 1, 2, 6) • What is the output?(groups 3, 4, 5)
Theory or principles for some parts/processes – four examples • Sampling and estimation • Mean Squared Error, MSE. • Response process • Comprehension, retrieval, ... • Data collection • Modes, type of data, timeliness etc. • Editing • Quality control.
Design work in brief Design • a forthcoming survey round • for statistics (macro data) or micro data • through appropriate competences • in cooperation/agreement with customers/users/stakeholders so that • quality is sufficient for the intended use, • the production is within budget and cost-effective (in the long run), and • with regard taken to respondents (burden).
To design you need to know • For appropriate choices and allocations: • The population and how to reach its objects/units. • Variations in the population and sub-groups. • How questions are interpreted. • Possibilities to reply, provide the information requested. • ...
How could you learn? • Pilot study • Qualitative, make “discoveries” • Quantitative, statistical inference • Embedded experiment • On-going survey • Utilise the sample
Responsive/adaptive design • Plan with successive decisions • Mostly described for household statistics and telephone interviewing • Information from previous rounds • Successive information this round (new survey) • Examples • “Mile-stones” with re-considerations • Reminder strategy, contact mode, …
Paradata, metadata-driven • Process data, paradata • Collect, suitably chosen set, with aim • Analyse and improve • Metadata • Information about the statistics • For the statistics production: parameters, …
What is included in an ”optimisation”? • Find e.g. the best quality for given cost and subject to a set of constraints, such as • Regulations. • Rules for data collection, response burden. • Resources, financial and personnel. • Quality depends on use(s) – user dialogue! • Quality is multi-facetted!
“Conclusions” – aspects on design • Teamwork • On-going work • Constraints assist • Metadata, paradata (process data) • Architecture: methodology, IT, … • Data integration