Download
1 / 35
350 likes | 491 Vues
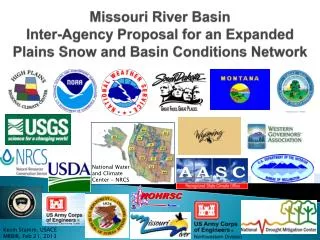
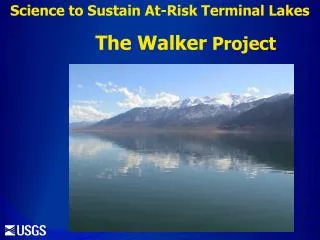
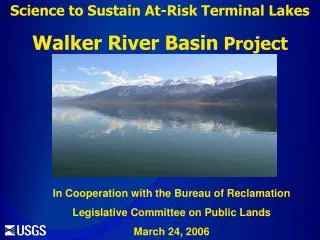
Science to Sustain At-Risk Terminal Lakes Walker River Basin Project. In Cooperation with the Bureau of Reclamation Legislative Committee on Public Lands March 24, 2006. Presentation Overview. Problem Objectives Status of activities Plans for upcoming year. Walker R. near Wabuska.

E N D
Science to Sustain At-Risk Terminal Lakes Walker River Basin Project In Cooperation with the Bureau of Reclamation Legislative Committee on Public Lands March 24, 2006
Presentation Overview • Problem • Objectives • Status of activities • Plans for upcoming year
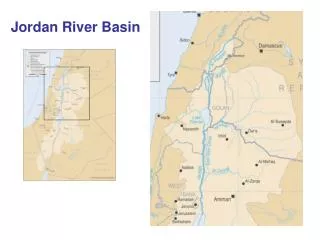
Walker R. near Wabuska Location of Walker River Basin Walker R. at Lateral 2-A near Schurz West Walker R. near Hudson East Walker R. above Strosnider Ditch near Mason
Objectives • Quantify streamflow in the Walker Basin • Estimate evapotranspiration from the lake and vegetation • Develop an improved water budget for Walker Lake • Develop the capability to predict how changes in upstream irrigation practices would affect flows to Walker Lake
Activities • Surface-Water (SW) network • Ground-Water (GW) network • Evapotranspiration (ET) network • Mapping vegetation, elevation, bathymetry • Preliminary streamflow analysis • Web Site
New Stream Gages Green Ck near Bridgeport Virginia Ck near Bridgeport
GW Network • GW sites
Ground-Water/Surface-Water Sites • Willows ET (above Weber) • Cow Camp Gage • Lateral 2-A Gage • Powerline Road • Walker River at Mouth
Willows Above Weber Lateral 2-A Powerline Road Walker River Mouth GW/SW Site Locations
Measured ET on Walker Lake Provisional-—Subject to revision
ET compared with RAWS Radiation Provisional-—Subject to revision
ET vs RAWS radiation Provisional—Subject to revision
Total ET for 2005 Water Year Provisional—Subject to revision Total 2005 Water Year ET = 1814 mm or 6.0 ft*
Results – ET from Walker Lake • ET for WY2005 was 6.0 ft*, up from previous estimates of 4.1 ft. • Area of Walker Lake in June 2005 was 32,000 acres. • Volume evaporated from Walker Lake in 2005 was 192,000 acre-ft*. • ~ 50% increase over previous estimates. • If relation between Lake ET and RAWS solar radiation holds, may be able to estimate annual ET from 1999-2004. * Provisional—Subject to revision
Salt Cedar site • Site underwent substantial defoliation due to introduction of a biologic control agent: Salt Cedar Leaf Beetle (Diorhabda elongata) • Changed characteristics and ET rate for large stand of Salt Cedar
Reduction of ET using Salt Grass Provisional—Subject to revision This is a 22% reduction in ET* 57 mm* 203 mm*
Results – ET Summary Provisional—Subject to revision 6.0 ft 3.5 ft 3.3 ft 2.8 ft 0.7 ft 0.7 ft 0.4 ft 0.4 ft
Mapping: • Satellite imagery • New imagery • Lidar • Bathymetry • Side-scan sonar Bathymetry
Scaling up of ET • Create map of ET units • Extrapolate ET data to ET units to estimate total ET in basin
Bathymetry Maximum depth Spring 2005 was 82.8 ft Provisional—Subject to revision
Tufa Mounds in Walker Lake? • Side-scan sonar • More GW inflow?
Click on Data link for interactive map page Web Site http://nevada.usgs.gov/walker/
Plans for This Year • Continue to collect data – Data network is essentially in full operation • Report on bathymetry of Walker Lake • Classify and map vegetation • Geophysics near Double Springs, river mouth, and south end of lake • Install additional observation wells to refine hydrologic understanding of GW system