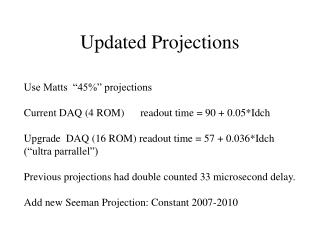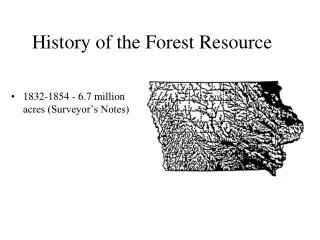
Update of Southern Forest Resource Projections
This study updates projections using FIA data and SRTS model for timberland trends and demand changes impact on pine and hardwood markets across the South.


Update of Southern Forest Resource Projections
E N D
Presentation Transcript
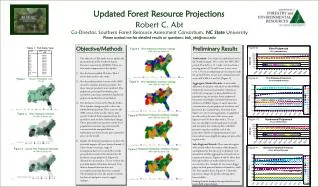
Objective/Methods Preliminary Results • The objective of this study was to update the projections from the Southern Forest Resource Assessment (SOFRA). There are four main components of the update. • Use the latest available FIA data. Table 1 shows data used for the study. • Use the multi-product version of the SRTS model to examine trends by product. For these runs six products were modeled. Pine pulpwood, pine small sawtimber, pine sawtimber, pine large sawtimber, hardwood pulpwood and hardwood sawtimber. • Use the latest version of the Hardie, Parks, Wear landuse change model to drive the timberland projections. These runs use the 2006 version of the model. Survey unit specific reduced form equations from the model are used to drive timberland change. These projections incorporate county level populations forecasts. Ag rents are held constant and the marginal shifts in timberland are driven by the pine sawtimber prices in the model. • Update the demand assumptions to show the potential impacts of lower future demand. A suite of runs covering a range of assumptions has been created. The results presented here reflect flat demand for all products except pulpwood. Pulpwood demand was increased a .5%/yr to show the potential impact of biomass demand. Note that no demand increase does not necessarily mean that harvest is constant. The demand curve for the product is fixed, but harvest and price react to supply changes. Timberland- Loss of private timberland across the South averaged .34%/yr for the 2005-2025 period. This led to a 11.3 mill. acre loss from a starting point of 174 mill. acres. Losses were over 1.3%/yr in urbanizing survey units in south FL and north GA. Losses were minimal in rural areas of KY, MS, LA and AL. [Figure 1] Aggregate Market Trends- A noticeable difference in the pine outlook from the SOFRA study is the increased sawtimber volumes at relatively young ages on pine plantations. As plantations age we project lower pulpwood inventories and higher sawtimber inventories relative to SOFRA. Figures 2 and 3 show the concentration of pine pulpwood inventory and harvest in the Coastal Plain. Note that these figures are survey unit aggregates, so quantities are affected by the size of the survey unit. Figures 8 and 10 show that with a .5%/yr increase in pulpwood demand, pine removals and inventory stay relatively flat, with little pressure on prices until the end of the projection. Hardwood pulp inventories and removals increase slightly keeping real prices flat region-wide. Sub-Regional Trends- These smooth region-wide trends reflect the nature of the demand assumptions for this run (e.g. no business cycle downturn) and the aggregation of trends across regions and owners. Figures 9 and 11 show that flat regional harvest masks shifts in harvest across states. For example AL becomes a bigger player in both pine and hardwood markets, while NC loses market share. Figures 4-7 show the inventory changes by product driving these harvest shifts. Funding from the Southern Group of State Foresters is gratefully acknowledged. Figure 4. Figure 3. Figure 1. Figure 5. Figure 2. Updated Forest Resource Projections Table 1. FIA Data Year Figure 8. Figure 9. Robert C. Abt Co-Director, Southern Forest Resource Assessment Consortium, NC State University Please contact me for detailed results or questions: bob_abt@ncsu.edu Figure 6. Figure 10. Figure 11. Figure 7.