Smart Traffic Control System Progress Report
The report details the progress made in developing a smart traffic control system. It includes adaptive green wave strategies, proportional fairness, and adjusting turn ratios to optimize traffic flow. The study proposes an advanced model and simulator, GLD in Java, to enhance traffic management efficiency.

Smart Traffic Control System Progress Report
E N D
Presentation Transcript
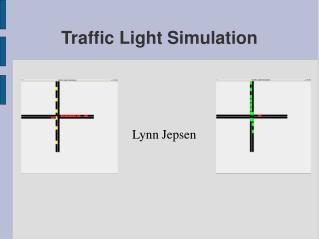
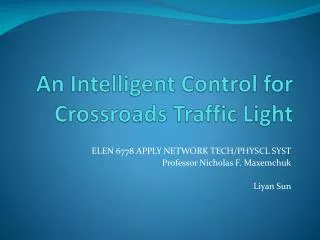
TRAFFIC LIGHT CONTROLPROGRESS REPORT YITIAN GU ADITI BHAUMICK VIPUL SINGH LIYAN SUN Professor Nicholas F. Maxemchuk
Progress • Build the 10*10 network (adjust the turn ratio) • Baseline 1 • Fixed green wave • Split the 90 seconds cycle time according to the flow ratio of different directions • Get average delay • Adaptive green wave • Try to empty the queue before cars approaching • Baseline 2 • Use proportional fairness on each single intersection and get the average delay • Consider an extra term (number of cars approach) in addition to the total waiting time
MODEL • Simulator – GLD (Java) • Two-way, left turn lane separately • Wrap around • Cars don’t disappear when they reach the end of the network, they re-enter the network instead • Adjust turn ratio to change the traffic flow for different directions
Traffic Condition • Make the traffic ratio coming from North to South is 50%, and the rest of the traffic is distributed averagely in other three directions. • Get turn ratio from traffic balance equation, for the traffic from north to south, 5% to turn left, 5% to turn right, and 15% for other lanes.
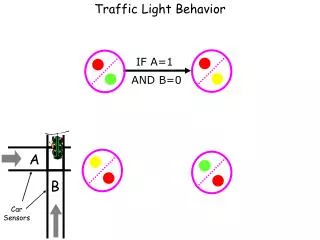
Adaptive Green Wave • The problem which we were working on was try to empty the queue in the green wave direction so that approaching cars that move in expected speed don’t have to stop or decelerated • Fixed green wave turn green at t1+Δ (offset, lane length/expected speed) • Now turn green at t1+Δ – σ(time to empty the queue)
Adaptive Green Wave • (a) Using the current information from the queue to set the green light earlier than what is required. In this we used the information from the queue of the present lane. • (b) For estimating the time to empty the queue, we have simulated and found out a function which represents the delay function. In the analysis we used 1,2,3,4,5,6,7,8,9,10 cars to get the time needed for queues of different length to cross the light
Proportional Fairness • Previously work has been done for a single intersection of traffic lights and metrics have been calculated based on Min-Max Fairness and Proportional Fairness. • What we have done is that we improve the algorithm of Proportional Fairness to each section so that each of them endures less average delay.
APPROACH • Previously, when we came across the average delay, what we used to compare is the sum of delay for each cars in each phase, called proportional fairness. • In addition that we took the sum of delay into account, we would also like to consider the number of cars approaching intersections.
APPROACH • We used a weight factor n, the cars entering and going through the lane that have not been stopped by the red lights, which could be gained from the following equation, to see if it can make contribution to decrease average delay.
The End Thanks!