Exploring Dogs' Sensitivity to Earth's Magnetic Field
Investigating if dogs align their poop with Earth's magnetic field. Sampling methods, biases, and representativeness. Why choosing a sample is crucial. The importance of representative sampling in research.


Exploring Dogs' Sensitivity to Earth's Magnetic Field
E N D
Presentation Transcript
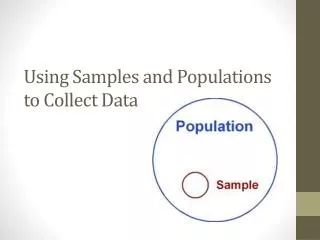
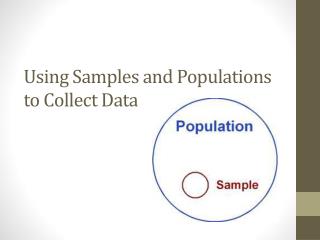
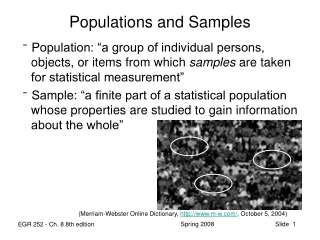
Population and sample Research Question Are dogs sensitive to the Earth’s magnetic field? Population All dogs Sample 70 dogs (37 different breeds) http://www.pbs.org/newshour/rundown/dogs-poop-in-alignment-with-earths-magnetic-field-study-finds/ Original study: http://www.frontiersinzoology.com/content/pdf/1742-9994-10-80.pdf
Why choose a sample? If we collect data from the entire population, we call this a census. Reasons we may not collect data from the entire population include: • too expensive • too time consuming • too time consuming • some subjects are unwilling to participate • the entire population cannot be identified • data collection might be a destructive process
Sampling is natural Here are a few “everyday” examples of decision making based on data collected from a sample: • You buy a product because a friend recommends it. • You buy a product because it has great reviews on Amazon.com • You stop using a product because the news featured a story about someone who had a terrible experience using the product. Common sense tells us that data collected from a few individuals might lead to results that are quite different from data collected from the entire population. What we need is for the sample to be essentially a small version of the population. We call this a representative sample.
Representative sampling is less natural Great care must be taken to choose a representative sample from a population. One of the main contributors to inaccurate statistical results is working with a sample that is not representative of the population. Common problems with sampling: • Anecdotal evidence (haphazardly choosing a sample) • Non-response bias • Voluntary-response bias • Convenience sampling
Anecdotal evidence Anecdotal evidence is information collected haphazardly. It typically has the following characteristics: • Only a few cases are considered (very small sample size) • There was no attempt to make the sample representative of the population • Focus is on evidence that is unusual, shocking, interesting, etc. Anecdotal evidence is often like this: • A man on the news got mercury poisoning from eating swordfish, so the average mercury concentration in swordfish must be dangerously high. • My friend’s dad had a heart attack and died after they gave him a new heart disease drug, so the drug must not work.
Anecdotal evidence and early smoking research • Smoking research started in the 1930s and 1940s when cigarette smoking became increasingly popular. While some smokers seemed to be sensitive to cigarette smoke, others were completely unaffected. • Anti-smoking study results were faced with resistance based on anecdotal evidence such as, “My uncle smokes three packs a day and he’s in perfectly good health.” • In time, researchers were able to examine larger samples of cases (smokers), and trends showing that smoking has negative health impacts became much clearer. Brandt, The Cigarette Century (2009), Basic Books.
Non-response bias If only a small fraction of people in a representative sample choose to respond to a survey, the sample may no longer be representative of the population. There has been a well-documented decline in household survey response rates in recent decades. The American Time Use Survey (ATUS) is designed to produce comprehensive information on how Americans use their time, and should deepen our understanding of family life. In 2004, the ATUS response rate was below 60%. Whether the responses obtained could be generalized to the target population was call into question. http://poq.oxfordjournals.org/content/70/5/676.full.pdf+html
Voluntary-response bias This occurs when the sample consists of people who volunteer to respond because they have strong opinions on the issue. Such a sample is unlikely to be representative of the population.
Convenience sampling Individuals who are easily accessible are more likely to be included in the sample. “One of the most contentious issues in consumer behavior research, and social science research generally, is the use of convenience samples of undergraduate college students as subjects in behavioral investigations.” http://www.mccombs.utexas.edu/~/media/Files/MSB/Research/Publications/2014Q1/Convenience%20samples%20of.pdf
How do we get a representative sample? The universally accepted method for choosing a representative sample is random selection. Ideal situation: You can enumerate every individual in the population and randomly select (using a computer algorithm) the number of individuals you want in your sample. Sometimes this ideal situation is not practical, but all acceptable sampling techniques for obtaining a representative sample are based on random selection.
Descriptive Statistics and Inferential Statistics Suppose we have chosen a random sample from a population and collected some data. Descriptive statistics refers to methods used to summarize the data collected from the sample. This usually entails numerical summaries (for example, averages) and graphical summaries (for example, a bar graph). Inferential statistics refers to methods used to estimate or predict something about a population, based on the data collected from the sample.
Sample Statistics and Population Parameters Suppose we have chosen a random sample from a population and collected some data. A statistic is a numerical summary (for example, an average) of the data collected from the sample. A parameter is a numerical summary (for example, an average) of the population data. The main idea: Starting with a statistic obtained from sample data, we use methods from inferential statistics to estimate the corresponding parameter of the population.