Download
1 / 13
130 likes | 256 Vues
Learn how to collect data effectively using samples and populations. Discover the importance of selecting a representative sample, analyzing data, and generalizing conclusions. Practice collecting data using fish populations and classroom surveys.

E N D
LAST TIME • We saw problems with data collection: • Researcher’s bias (e.g., the Christmas question) • Use of language (e.g., “recreational activities” rather than “skateparks”) – especially not being specific enough (e.g., “how large is this textbook”) • Not making quantitative answers (we need to get a number at the end) • Not giving enough options (e.g., “what kind of music is best: country or pop?”) • Time and $ (e.g., the Inuit art problem)
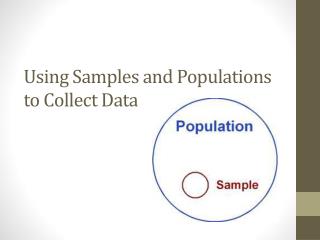
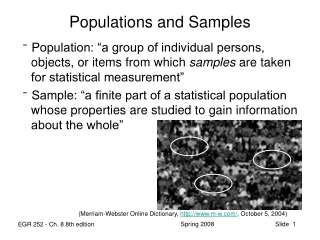
To solve problems of time and $$$$$ • Select a SAMPLE from the POPULATION
Investigate • Number off 1-6 – move to new tables • In table group: • Cut 50 small pieces of paper – equal sizes • Label each piece of paper with either ‘F’ (female) or ‘M’ (male) – you choose how many • On a piece of paper, record the percents (%) of F and M fish in your population • Fold the pieces of paper • Trade populations with another table
Investigate (part II) • Choose a sample of 10 fish • Record the number of M and F fish in your sample • Estimate the percents of M and F in the population – write down • Repeat: with sample of 20 fish • Repeat: with sample of 40 fish • Discuss and write response: Did your estimates of the percents of male and female fish change as the sample size changed? Explain.
Follow-up • Compare table group results • Discuss: How did the estimates change as the size of the sample increased?
Why was a population surveyed instead of a sample? • To determine the average number of siblings of his classmates, Carlos surveyed each person in the class. • Every 5 years, Statistics Canada conducts a census. One question in the survey is used to determine the ages of the people in each household.
Why was a sample used instead of a population? • To determine the average lifetime of a type of lightbulb, 150 lightbulbs were selected randomly from the production line and tested.
When using a sample • When the sample chosen is representative of the population, the data collection provides valid conclusions • E.g., testing 100 game consoles out of 1000 made each day is a sample. If those consoles tested represent the typical quality of consoles made in the factory, the conclusions of the data collection will be valid. • Be careful: • Large sample data collection could be $$$ or time consuming • Small sample may not be representative of the population
Generalization • When you get a valid conclusion, you can generalize to the population
To Do 1. In each case, describe the population: • Garden Valley School Division wants to find out which schools need renovations. • The government wants to find out the average age of First Nations people in Nunavut. 2. In each case, are the data collected from a census or a sample? • To determine the favourite TV show of grade 9 students in a school, all grade 9 students in the school are surveyed. • To find out if customers of a chain of coffee shops are happy with the service, some customers in every shop were surveyed. 3. Identify the population you would sample to find out opinions on: • the GST • the cost of a GVC yearbook • emergency room wait times 4. Why are data collected from a sample and not a census for this situation?: To determine the number of hours an AAA battery will last in a calculator. 5. Should a census or a sample be used to collect data about the number of grade 12 students in GVC who have braces? Why or why not? 6. To test for pesticide pollution, a scientist collects and tests one vial of water from a river. From the results, a local newspaper reporter concludes that there are dangerous levels of pesticide in the river. Is the conclusion valid? Explain. 7. Pretend you are the manager of the GVC cafeteria. You want to create a new lunch menu for students. • What population are you interested in surveying? • Would you survey a sample or a population? Explain. • If you had to use a sample, what would you do to make sure your conclusions are valid? 1 mark/answer = /13