Download
1 / 1
10 likes | 210 Vues
Molecular components of B cell antigen receptor-mediated endocytosis revealed by CLASSIFI: a tool for functional classification of microarray gene clusters

E N D
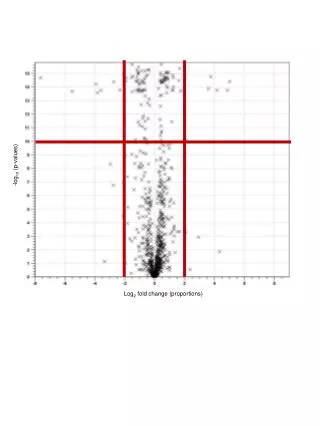
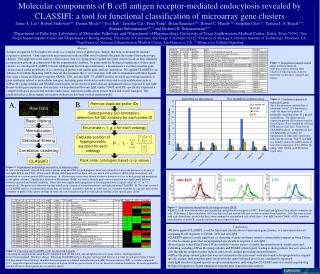
Molecular components of B cell antigen receptor-mediated endocytosis revealed by CLASSIFI: a tool for functional classification of microarray gene clusters Jamie A. Lee†, Robert Sinkovits§††, Dennis Mock§††, Eva Rab†, Jennifer Cai†, Peng Yang†, Brian Saunders§††, Robert C. Hsueh‡††, Sangdun Choi||††, Tamara I. A. Roach*††, Shankar Subramaniam§¶††, and Richard H. Scheuermann†§†† †Department of Pathology, Laboratory of Molecular Pathology and ‡Department of Pharmacology, University of Texas Southwestern Medical Center, Dallas, Texas 75390; §San Diego Supercomputer Center and ¶Department of Bioengineering, University of California, San Diego, California 92122; ||Division of Biology, California Institute of Technology, Pasadena, CA; *San Francisco Veterans Administration Medical Center, San Francisco, CA; ††Alliance for Cellular Signaling Included on microarray Not included on microarray Raw Data Basic filtering Normalization Statistical filtering Correlation clustering CLASSIFI CD40L LPS Anti-IgM Abstract Antigen recognition by B lymphocytes leads to a complex series of phenotypic changes that help orchestrate the immune response to infection. Gene expression microarrays provide excellent tools to identify the genes that control these phenotypic changes. One approach to the analysis of microarray data is to group genes together into gene clusters based on their similarity in expression patterns in comparison with the experimental variables. To understand the biological significance of these gene clusters, we developed CLASSIFI (CLuster ASSIgnment For biological Inference), a bioinformatics tool that classifies gene clusters based on the probability of co-clustering of probes with similar gene ontology annotation. We applied CLASSIFI to an Alliance for Cellular Signaling (AfCS) data set that examines the in vitro responses of B cells to stimulation with three ligands that cause a strong proliferative response: CD40L, LPS, and anti-IgM. CLASSIFI analysis revealed an overrepresentation of gene ontologies related to intracellular transport, including genes involved in endocytosis and vesicle acidification such as ATPase H+ pump subunits and SNARE-related genes, in the cluster of genes that are upregulated only in response to anti-IgM. Based on this gene expression data analysis, we hypothesized that anti-IgM, unlike CD40L and LPS, specifically stimulates a complex biological process that includes endocytosis, endosome acidification, vesicle fusion and vesicle transport. The predicted effect of these ligands on receptor endocytosis has been verified experimentally. Figure 3.Intracellular transport-related genes in Gene Cluster 18. Selection of genes found in Gene Cluster 18 with functions related to endosome acidification, transport and fusion. Figure 4.Coordinate expression of endocytosis genes. Since the microarray methodology is inherently “noisy”, it is important to verify the expression pattern of potentially interesting genes by a parallel methodology. The ligand-specific expression pattern of four genes found in Gene Cluster 18 was verified by real-time PCR analysis (left side). Based on the CLASSIFI analysis, we hypothesize that anti-IgM might also induce the upregulation of other genes involved in endosome processing. Indeed, anti-IgM was found to induce the mRNA levels of four other components of the ATPase H+ pump, while CD40L and LPS did not (right side). B. A. Remove duplicate probe IDs Select primary GO annotation; determine full GO ancestry for each probe ID Enumerate n, f, g, c for each ontology Calculate solution of hypergeometric equation for each ontology g - f f n - 1 i c - i 1 - P = g i = 0 c Rank order ontologies based on p values Figure 1.Experimental methodology and analysis of microarray data. B cells were negatively selected from mouse spleens using anti-CD43-coated magnetic beads and cultured for 4 hrs in the presence or absence of anti-IgM, LPS or anti-CD40. Fluorescently-labeled cRNA prepared from these cells was mixed with a reference cRNA (from total spleen) and hybridized to a custom spotted cDNA microarray. A. Fluorescence values were filtered to remove features too close to background and normalized to the spleen reference. Significance Analysis of Microarrays (SAM) was used to identify genes whose expression was significantly different between untreated and treated conditions. Genes that were significantly upregulated or downregulated were assigned values of “+1” or “-1”, respectively. The genes were clustered together based on the categorical expression patterns, and analyzed using CLASSIFI. B. The steps involved in CLASSIFI analysis of clustered microarray data are detailed. g=number of probes in entire data set, c=number of probes in a specific gene cluster, f=number of probes with a given ontology in entire data set, n=number of probes with a given ontology in the specific gene cluster. Figure 5.Internalization through the B cell antigen receptor (BCR) WEHI-231 cells were treated with a non-stimulating anti-IgM mAb conjugated to FITC. Polyclonal anti-IgM was then added to stimulate the cells. Following a 1-hour stimulation, cells were harvested and washed with acid to remove surface-bound antibody. Cells that were washed with acid (dotted lines) or not (solid lines) were compared to unstimulated cells (black lines). Anti-IgM, but not CD40L or LPS, stimulates internalization of the BCR, as predicted from the gene expression data. • Conclusions • We have applied CLASSIFI, a tool for functional classification of microarray gene clusters, to a microarray data set comparing B cell responses to CD40L, LPS, and anti-IgM. • CLASSIFI analysis reveals significant co-clustering of gene ontologies related to intracellular transport in Gene Cluster 18, which contains genes that are upregulated specifically in response to anti-IgM. • Several genes within Gene Cluster 18 are related to various aspects of endosome internalization, acidification and trafficking, including ATPase H+ pump subunits and SNARE-related genes, leading to the hypothesis that activation of B cells through the antigen receptor induces endocytosis, antigen processing and presentation. • ATPase H+ pump subunit genes that were not included on the microarray were also found to be upregulated in a ligand-specific manner, indicating that genes involved in the same biological process are coordinately expressed. • Anti-IgM stimulates ligand-specific receptor internalization, indicating that CLASSIFI analysis is useful in predicting biological responses to ligand stimulation from the gene expression data analysis. Figure 2. Clustering and CLASSIFI results for data from 3 ligands. Clustering of categorical data from B cells stimulated with CD40L, LPS, and anti-IgM results in 19 gene clusters. Red=upregulated. Green=downregulated. Black=no change. Following CLASSIFI analysis, the gene ontology with the lowest p value in each gene cluster is listed. GO id=a unique Gene Ontology identifier that corresponds to a defined molecular function (MF), biological process (BP), or cellular component (CC). Expt=the expected number of occurrences of a given GO id in a given cluster of size (n) based on a random distribution. Prob=the probability that the GO id co-cluster pattern has occurred by chance.