Metro 2010-2045 Growth Distribution Process
360 likes | 485 Vues
This document outlines the process and schedule for the 2010-2045 Regional TAZ Forecast Allocation, focusing on the MetroScope equilibrium model for forecasting supply and demand in real estate. It discusses key assumptions, including zoning data, capacity information, and demographic forecasts, alongside employment projections. The methodology encompasses diverse models to assess residential and non-residential demand, alongside job location choices, travel times, and access data. This update aims to inform the Metropolitan Transportation Advisory Committee (MTAC) regarding essential planning metrics.

Metro 2010-2045 Growth Distribution Process
E N D
Presentation Transcript
Metro 2010-2045 Growth Distribution Process Project Update to MTAC January 4, 2012
Process Outline and Schedule – page1 2010-45 Regional TAZ Forecast Allocation
Process Outline and Schedule – page2 2010-45 Regional TAZ Forecast Allocation
MetroScope – equilibrium supply and demand real estate forecast model Integrated land use & transportation model to forecast TAZ-level employment and households. Key forecast & policy assumptions: Zoning data Capacity (supply) information – residential and employment Regional forecast data (demand) Metroscope 2010-45 Regional TAZ Forecast Allocation
HIA Demand Forecast Travel Times/Access (Travel Demand Model) Job Demand Forecast HIA location choices Job location choices Job Location Choices MetroScope Residential Model MetroScope Non-Residential Model HIA Location Choices Land Supply / Capacity Data Vacant Land, Refill Supply, UR etc. MetroScope Model Schematic Demand Output Supply 2010-45 Regional TAZ Forecast Allocation
HIA Demand Forecast Travel Times/Access (Travel Demand Model) Job Demand Forecast MetroScope Residential Model MetroScope Non-Residential Model HIA Location Choices Land Supply / Capacity Data (MetroScope models the real estate demand factors) Metroscope: DEMAND DATA 2010-45 Regional TAZ Forecast Allocation
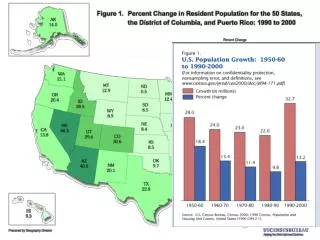
Demand Data: Population Forecast (PMSA) • Pt+1= Pt + bt – dt + mt (population eq.) (x-axis denominated in years) 2010-45 Regional TAZ Forecast Allocation
Demand Data: Population Forecast PMSA: Range Forecast Range ~ 2 std. dev. 2010 Population: 2,226,009 (Census) 2035 Population: 3,210,000 (yellow line) 2010-45 Regional TAZ Forecast Allocation
Demand Data: Population Forecast Metro Council opts in UGB decision: Lower middle-third forecast range point value is assumed for 2010-45 TAZ Forecast (Gamma 2.0) Lower middle-third forecast range point value Standard Deviation 2010-45 Regional TAZ Forecast Allocation
Demand Data: Population Forecast Convert household count to HIA distributions • Iterative techniques use • 2000 Census PUMS data to estimate households by : • Household size (7) • Income bracket (16) • Age of household head (7) 2010-45 Regional TAZ Forecast Allocation
Demand Data: Employment Forecast PMSA: Range Forecast Range ~ 2 std. dev. 2010 Population: 2,226,009 (Census) 2035 Population: 3,210,000 (yellow line) 2010-45 Regional TAZ Forecast Allocation
Demand Data: Employment Forecast 2010-45 Regional TAZ Forecast Allocation
HIA Demand Forecast Travel Times/Access (Travel Demand Model) Job Demand Forecast MetroScope Residential Model MetroScope Non-Residential Model HIA Location Choices Land Supply / Capacity Data (MetroScope models the real estate supply-side capacity components) Metroscope: supply data 2010-45 Regional TAZ Forecast Allocation
Supply Data: MetroScope Capacity Concepts 2010-45 Regional TAZ Forecast Allocation
Supply Data: Metro UGB Residential 2010-45 Regional TAZ Forecast Allocation 2010-45 Regional TAZ Forecast Allocation
Supply Data: Metro UGB Non-Res. 2010-45 Regional TAZ Forecast Allocation
Supply Data: Subsidized Redevelopment 2010-45 Regional TAZ Forecast Allocation
Supply Data: Metro Urban Reserves 2010-45 Regional TAZ Forecast Allocation
Supply Data: Ex-UGB Capacity 2010-45 Regional TAZ Forecast Allocation
Supply Data: Clark County Clark County Residential DU Capacity Estimates: SF = 67,000 MF=45,700 2010-45 Regional TAZ Forecast Allocation
Supply Data: Residential Capacity (PMSA) 2010-45 Regional TAZ Forecast Allocation
Supply Data: Capacity by Type (UGB) 2010-45 Regional TAZ Forecast Allocation
Supply Data: Single Family Capacity (UGB) 2010-45 Regional TAZ Forecast Allocation
Supply Data: Multi-family Capacity (UGB) 2010-45 Regional TAZ Forecast Allocation
HIA Demand Forecast Travel Times/Access (Travel Demand Model) Job Demand Forecast MetroScope Residential Model MetroScope Non-Residential Model HIA Location Choices Land Supply / Capacity Data Travel time skims linked to residential zones are a factor in determining residential location choice Metroscope travel demand data 2010-45 Regional TAZ Forecast Allocation
Travel Demand Data: Travel Times Travel Time from Portland CBD Modeled 2010 2-hour PM Peak An example of typical travel time O-D pairings between downtown Portland and elsewhere in the region 2010-45 Regional TAZ Forecast Allocation
Travel Demand Data: Travel Times Travel Time from Wilsonville Modeled 2010 2-hour PM Peak 2010-45 Regional TAZ Forecast Allocation
Travel Demand Data: Travel Networks Networks in TAZ GAMMA Forecast 2010 existing 2017 network 2035 RTP Federal (Constrained) 2035 RTP State (Strategic) 2010-45 Regional TAZ Forecast Allocation
HIA Demand Forecast Travel Times/Access (Travel Demand Model) Job Demand Forecast MetroScope Residential Model MetroScope Non-Residential Model HIA Location Choices Land Supply / Capacity Data An equilibrium solution (balancing supply and demand for housing) is derived from the regulated buildable land inventory (BLI) and Metro “lower middle-third” regional population & employment forecast. METROSCOPE LAND USE TAZ ALLOCATION FORECAST 2010-45 Regional TAZ Forecast Allocation
Recap and Next Steps • Progress to date - accomplishments • Concerns (next slide) • Research agenda to address concerns 2010-45 Regional TAZ Forecast Allocation
Gamma 1.0 TAZ Forecast: Preliminary Forecast Key Concerns - Forecast Inputs and Assumptions: • Single family housing supply • Equity and price effects (economic dislocations) • Redevelopment (economic thresholds) • Redevelopment of relatively new development • Mixed use residential (horizontal districts) • Mixed use residential density assumptions (MUR 9-10) • Market differentiation by household type, tenure and location 2010-45 Regional TAZ Forecast Allocation
Research Agenda • Proposed improvements to the forecast distribution process:* • Residential choice study enhanced with market segmentation • Redevelopment supply assumption refinement • Review actual development densities in high density multifamily and mixed use residential zone classes *depending on funding availability 2010-45 Regional TAZ Forecast Allocation
Examples illustrating key concerns – SINGLE FAMILY, FUTURE PRICING TRENDS AND EQUITY
Beta TAZ Forecast: Preliminary Household Forecast – SFR/MFR splits 2010-45 Regional TAZ Forecast Allocation
Beta TAZ Forecast: Preliminary Household Forecast – SFR Price Projection • SF inventories are expected to dwindle faster than replenishment rates • Causing a surplus in SF residential demand • Resulting in further increases in SF home prices over the forecast 2010-45 Regional TAZ Forecast Allocation
Beta TAZ Forecast: Preliminary Household Forecast (SF) 2010-45 Regional TAZ Forecast Allocation