Download
1 / 34
370 likes | 819 Vues
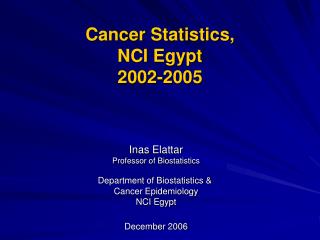
Cancer Statistics, NCI Egypt 2002-2005. Inas Elattar Professor of Biostatistics Department of Biostatistics & Cancer Epidemiology NCI Egypt December 2006. Contributors. Dr. Nelly Hassan Dr. Manar Mounir Dr. Amani El-Basmi Dr. Dalia Belal Dr. Naguiba Aref Dr. Maisa Kamel.

E N D
Cancer Statistics, NCI Egypt2002-2005 Inas Elattar Professor of Biostatistics Department of Biostatistics & Cancer Epidemiology NCI Egypt December 2006
Contributors • Dr. Nelly Hassan • Dr. Manar Mounir • Dr. Amani El-Basmi • Dr. Dalia Belal • Dr. Naguiba Aref • Dr. Maisa Kamel Department of Biostatistics & Epidemiology NCI Egypt
National Cancer Institute, Cairo, Egypt • The National Cancer Institute (NCI) is the largest comprehensive cancer center in Egypt • The present hospital with its 530 beds is overloaded by patients referred from allover the country • The NCI for years had a well established Pathology-Based and an Inpatient-Based Cancer Registries • Our first attempt towards a Hospital-Based Cancer Registry was in the year 2001
National Cancer Institute, Cairo, Egypt,Results Overview • Over a 36 year period (1970 – 2005) more than 300,000 new patients visited the NCI, and in excess of one million outpatient visits. • About 65% of patients are treated free of charge and private patients generally have health insurance which covers their cost. • In the years 2002-2005, 78,010 new patients were seen at the NCI, and the number of outpatient visits was approximately 170,000 visits/year.
National Cancer Institute, Cairo, Egypt,Results Overview • In the year 2005 there were: • 20,326 new patients seen at the NCI • More than 14,000 hospital admissions • Approximately 170,000 outpatient visits. • 70% of patients came from the Greater Cairo area, 13% from lower Egypt, & 16% from upper Egypt. • 40 % of cases were males • 85 % of cases were married
Basis of Diagnosis • Pathology report from NCI, or after slide revision • Diagnosis reported explicitly by the treating doctor • Log books of specialized clinics as chest, pain and radiotherapy • Lastly if the pathologic or laboratory diagnosis were not verified, clinical diagnosis is considered
Data management and data quality • Assurance of completeness through continuous generation of patients' lists who do not have diagnosis, or those not classified as cancer or non-cancer • Checking essential demographic data as age or date of birth, sex or address are done. Patient lists were evaluated for duplicates • Internal quality checks: random selection of some records was done systematically for double checks of data abstraction and to ensure completeness
Lung, Bronchus & Mesothelioma Males (7%) Females (2%)
Genitourinary Systems Males (20%) Females (6%)
Lymphoma & Multiple Myeloma Males (11%) Females (7%)
Leukemia Males (9%) Females (6%)
Childhood Cancer,NCI 2002-05 Age less than 20 years
Frequency of Children Age <20 Years by Year at Diagnosis and Gender
Leukemia, Children 2002-05 Males (35%) Females (33%)
Lymphoma, Children 2002-05 Males (21%) Females (12%)